
- Introducing the Spanish population
- The Spanish population in the remote past
- The Spanish Population from 1850 on
- THE SPANISH POPULATION TODAY
Introducing the Spanish population
Is Spain a highly populated country?
According to its 2018 census, Spain has a total of 46.72M inhabitants, making it the fifth most populated country in Europe right behind Germany, France, the United Kingdom, and Italy. Its capital city, Madrid, has around 3.22M inhabitors, ranking third in the list of largest European cities behind London (8.7M) and Berlin (3.5M). In terms of the metro area, Madrid’s 6.4M population is only overpassed by that of French and British capitals, far away from Berlin (5.2M) and Rome (4.3M) numbers. Spain’s second most populated city is Barcelona, the 1.6M inhabitors capital of the North-Eastern region of Cataluña. In comparative terms, Barcelona belongs to a selected group of large «second cities» in European countries such as Hamburg (1.7M) in Germany or Milan (1.4M) in Italy, leaving way behind Birmingham’s 1.1M and Marseille’s 790,000 inhabitants. The Top-5 is completed by Valencia (791K), Sevilla (688K) and Zaragoza (666K), which are capitals to Comunidad Valenciana, Andalucía and Aragón regions, respectively. A sixth city also breaks the half-million inhabitors barrier, Málaga, a major tourism capital of the Southern coast (571K), turning Spain into one of the two only European countries (along with Germany) to have more than 5 half-million population cities.
In international terms, Spain ranks thirtieth in the most populated countries list, right between Colombia and Uganda. Its population size is of the order of South Korea, Kenya or Ukraine’s one, and has kept a rather constant global relative position, ranking 24th in the year 1980 and 29th in the year 2000. The exact position might vary in the upcoming years, as the current Spanish population growth rate is approximately null, which predicts the country is likely to lose some steps to rapidly-developing African and Middle East states such as Algeria (42M), Sudan (42M) or even Iraq (38M). When evaluated at an international scale, the Madrid and Barcelona metro areas lose weight, even if they both enter the world’s Top-100 list in positions between 75 and 100 depending on the measuring method. This is, however, a common path in European metro areas, affecting even London and Paris ones, which fall to positions 29 and 34, respectively.
Despite its relatively high position on the international scale and the well-performing Spanish capital cities in demographic size terms, the country presents lower population numbers than its Western European neighbors. This means that, from the perspective of countries with similar socio-economic characteristics, the Spanish population numbers are below expectations given its size, economic development, and geographical position. The key concept explaining that miss-performance is nothing but population density, that is, the geographical distribution of the Spanish inhabitants.
Is Spain a densely populated country?
Population density is measured as the number of people living in a square kilometer, and it is useful for understanding how inhabitors are geographically distributed. As of 2018, Spain’s population density was 93 people per squared kilometer, a much lower number than Italy’s 200, Germany’s 232, France’s 123 or even Portugal’s 111 inhabitors per squared kilometer. In an international scale, Spain is the 91st most densely inhabited country, in the line of Syria, Romania or Cambodia, which are all much smaller and less populated states. This essentially implies the Spanish population is highly concentrated in few cities, whereas the vast majority of the national territory is left empty.
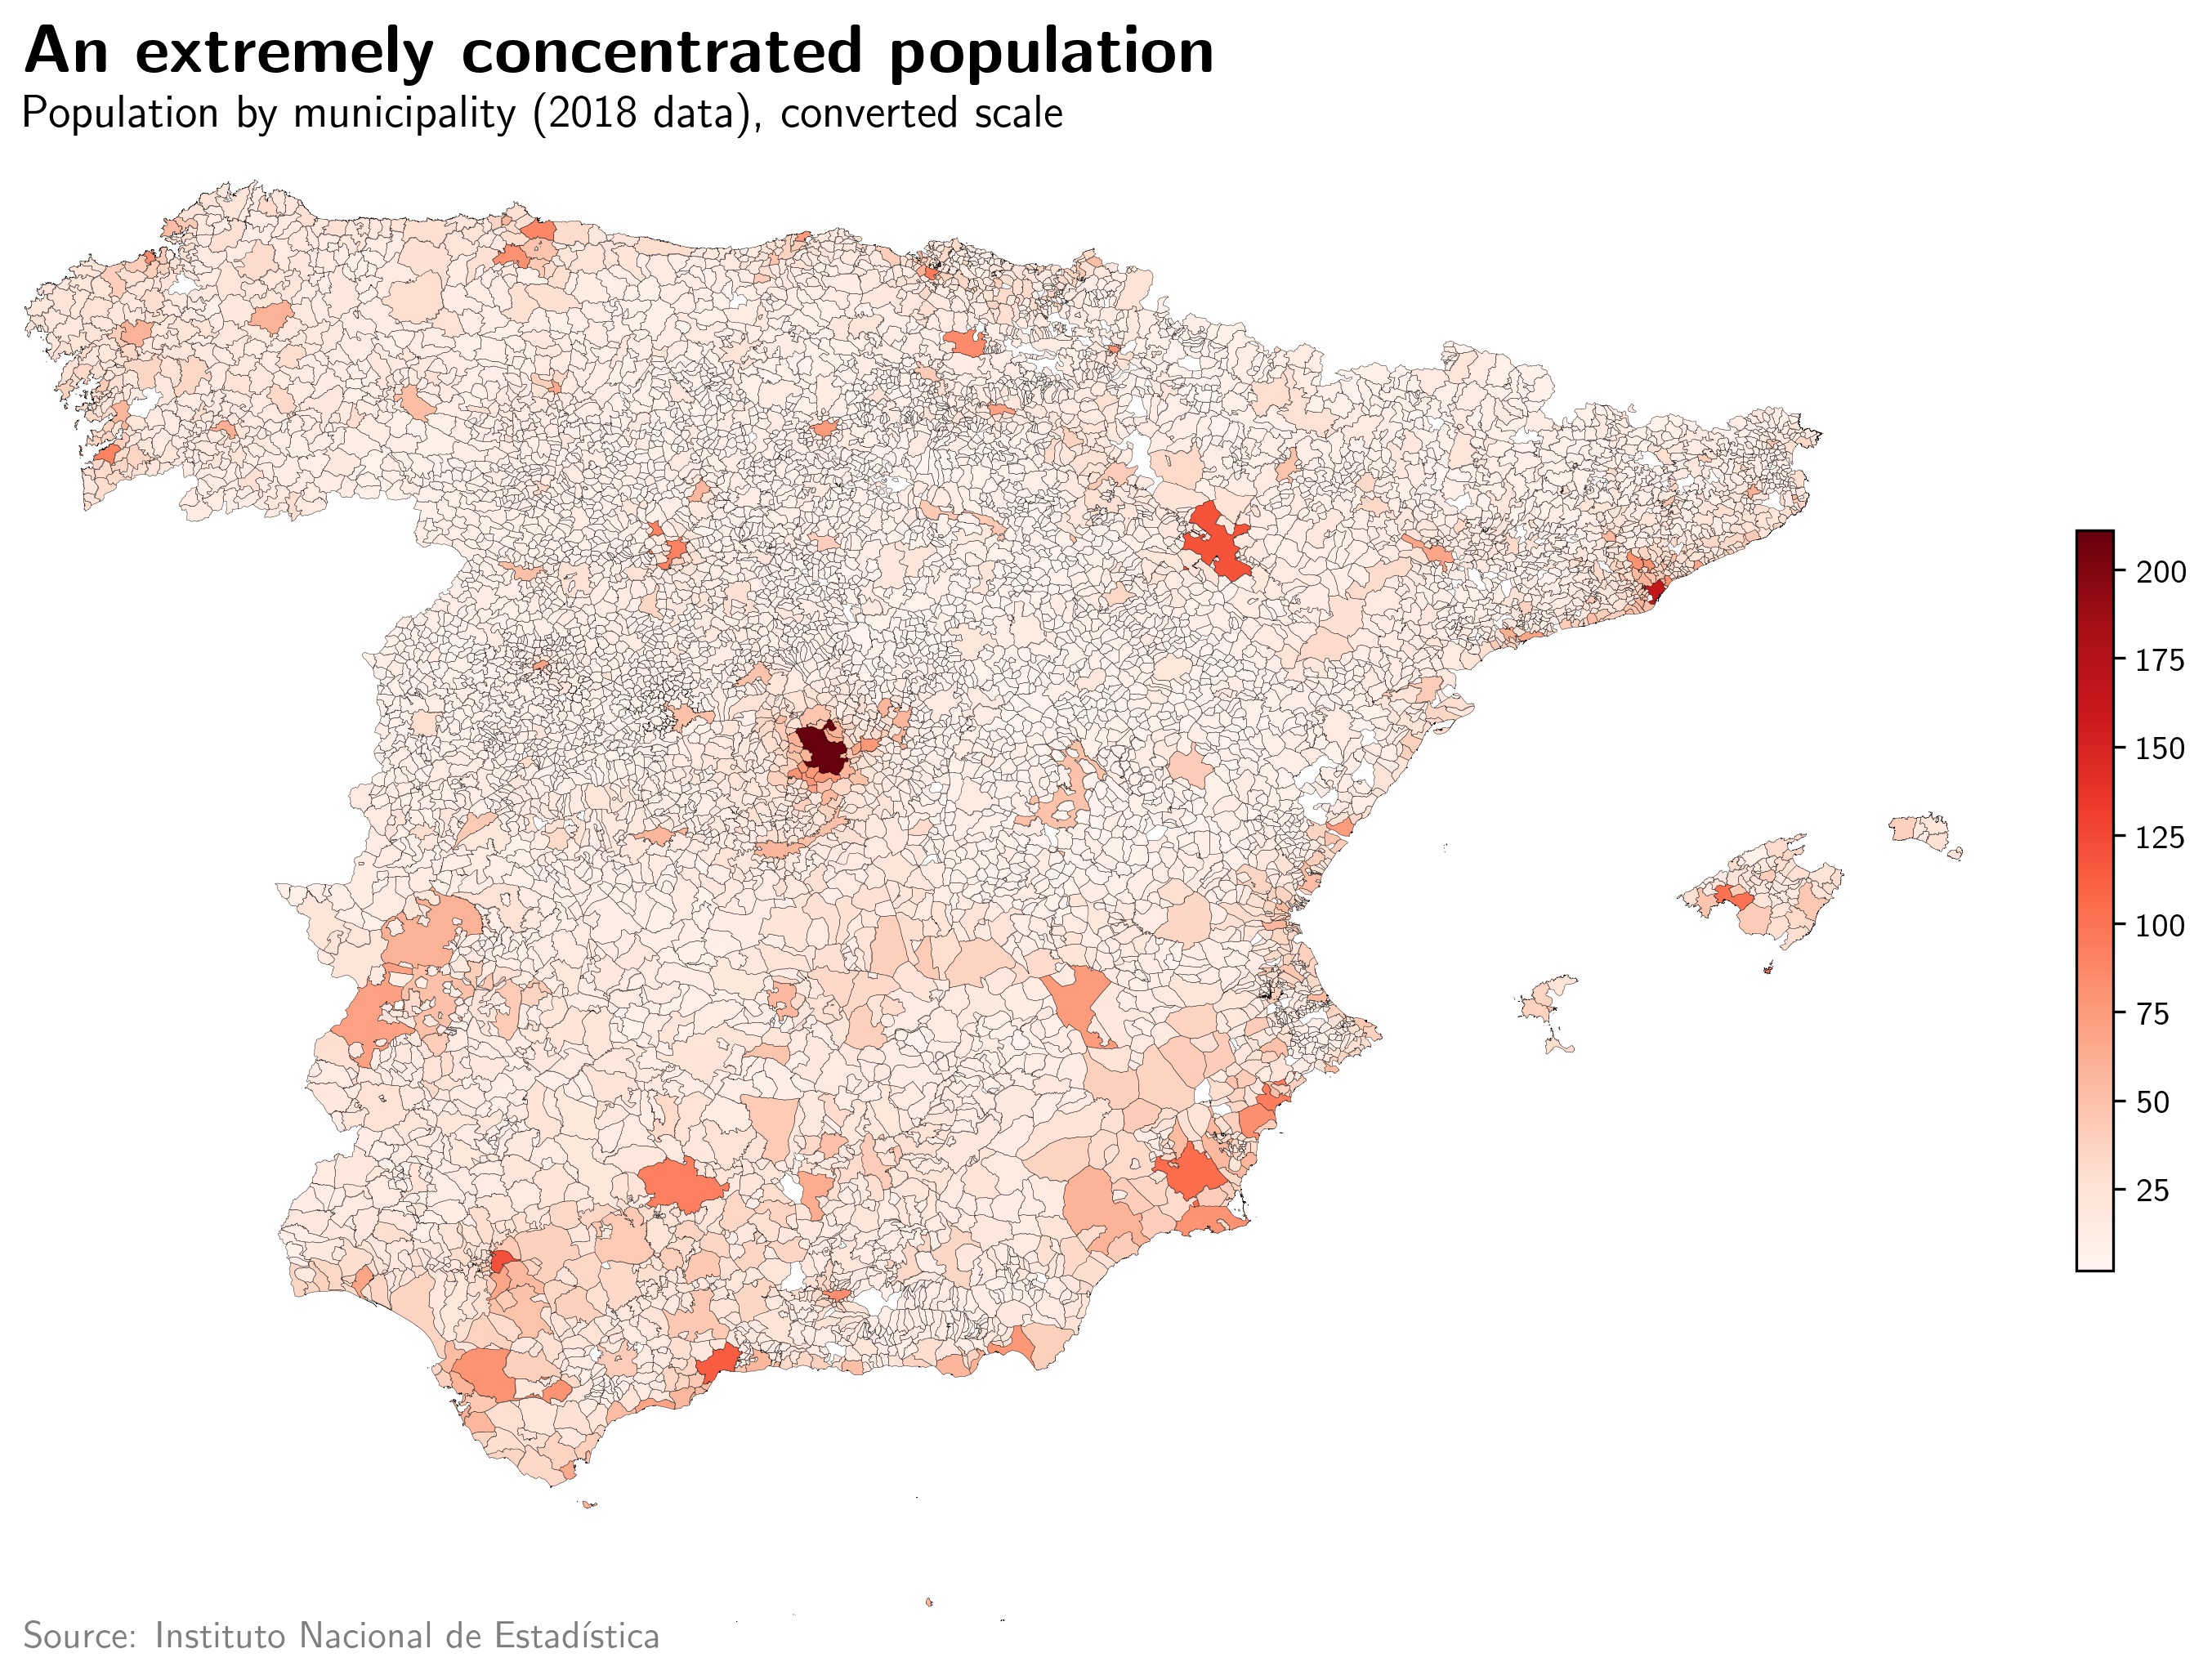
Some comparisons can effectively highlight the issue of people’s geographical distribution. Provinces of Madrid and Barcelona alone account by a fifth of the national population. The sum of Valencia, Cataluña, and Andalucía regions adds up to half of the Spanish inhabitants. None of the core regions (Castilla-la Mancha, Castilla y León or Extremadura) exceeds total Madrid city population and the sum of the four Northern communities (Galicia, Asturias, Cantabria and País Vasco) equals the demographic size of the Barcelona province. The European Statistical Office (EUROSTAT) defines a demographic desert as any territory with a population density of 10 inhabitors per square kilometer or less. Two of the 51 Spanish provinces (Toledo and Soria) qualify as human deserts, and three of them do not double that threshold (Cuenca, Zamora, and Huesca). The same pattern arises when looking at municipality-scale data, which can be used to compute the Gini index for the Spanish population distribution.
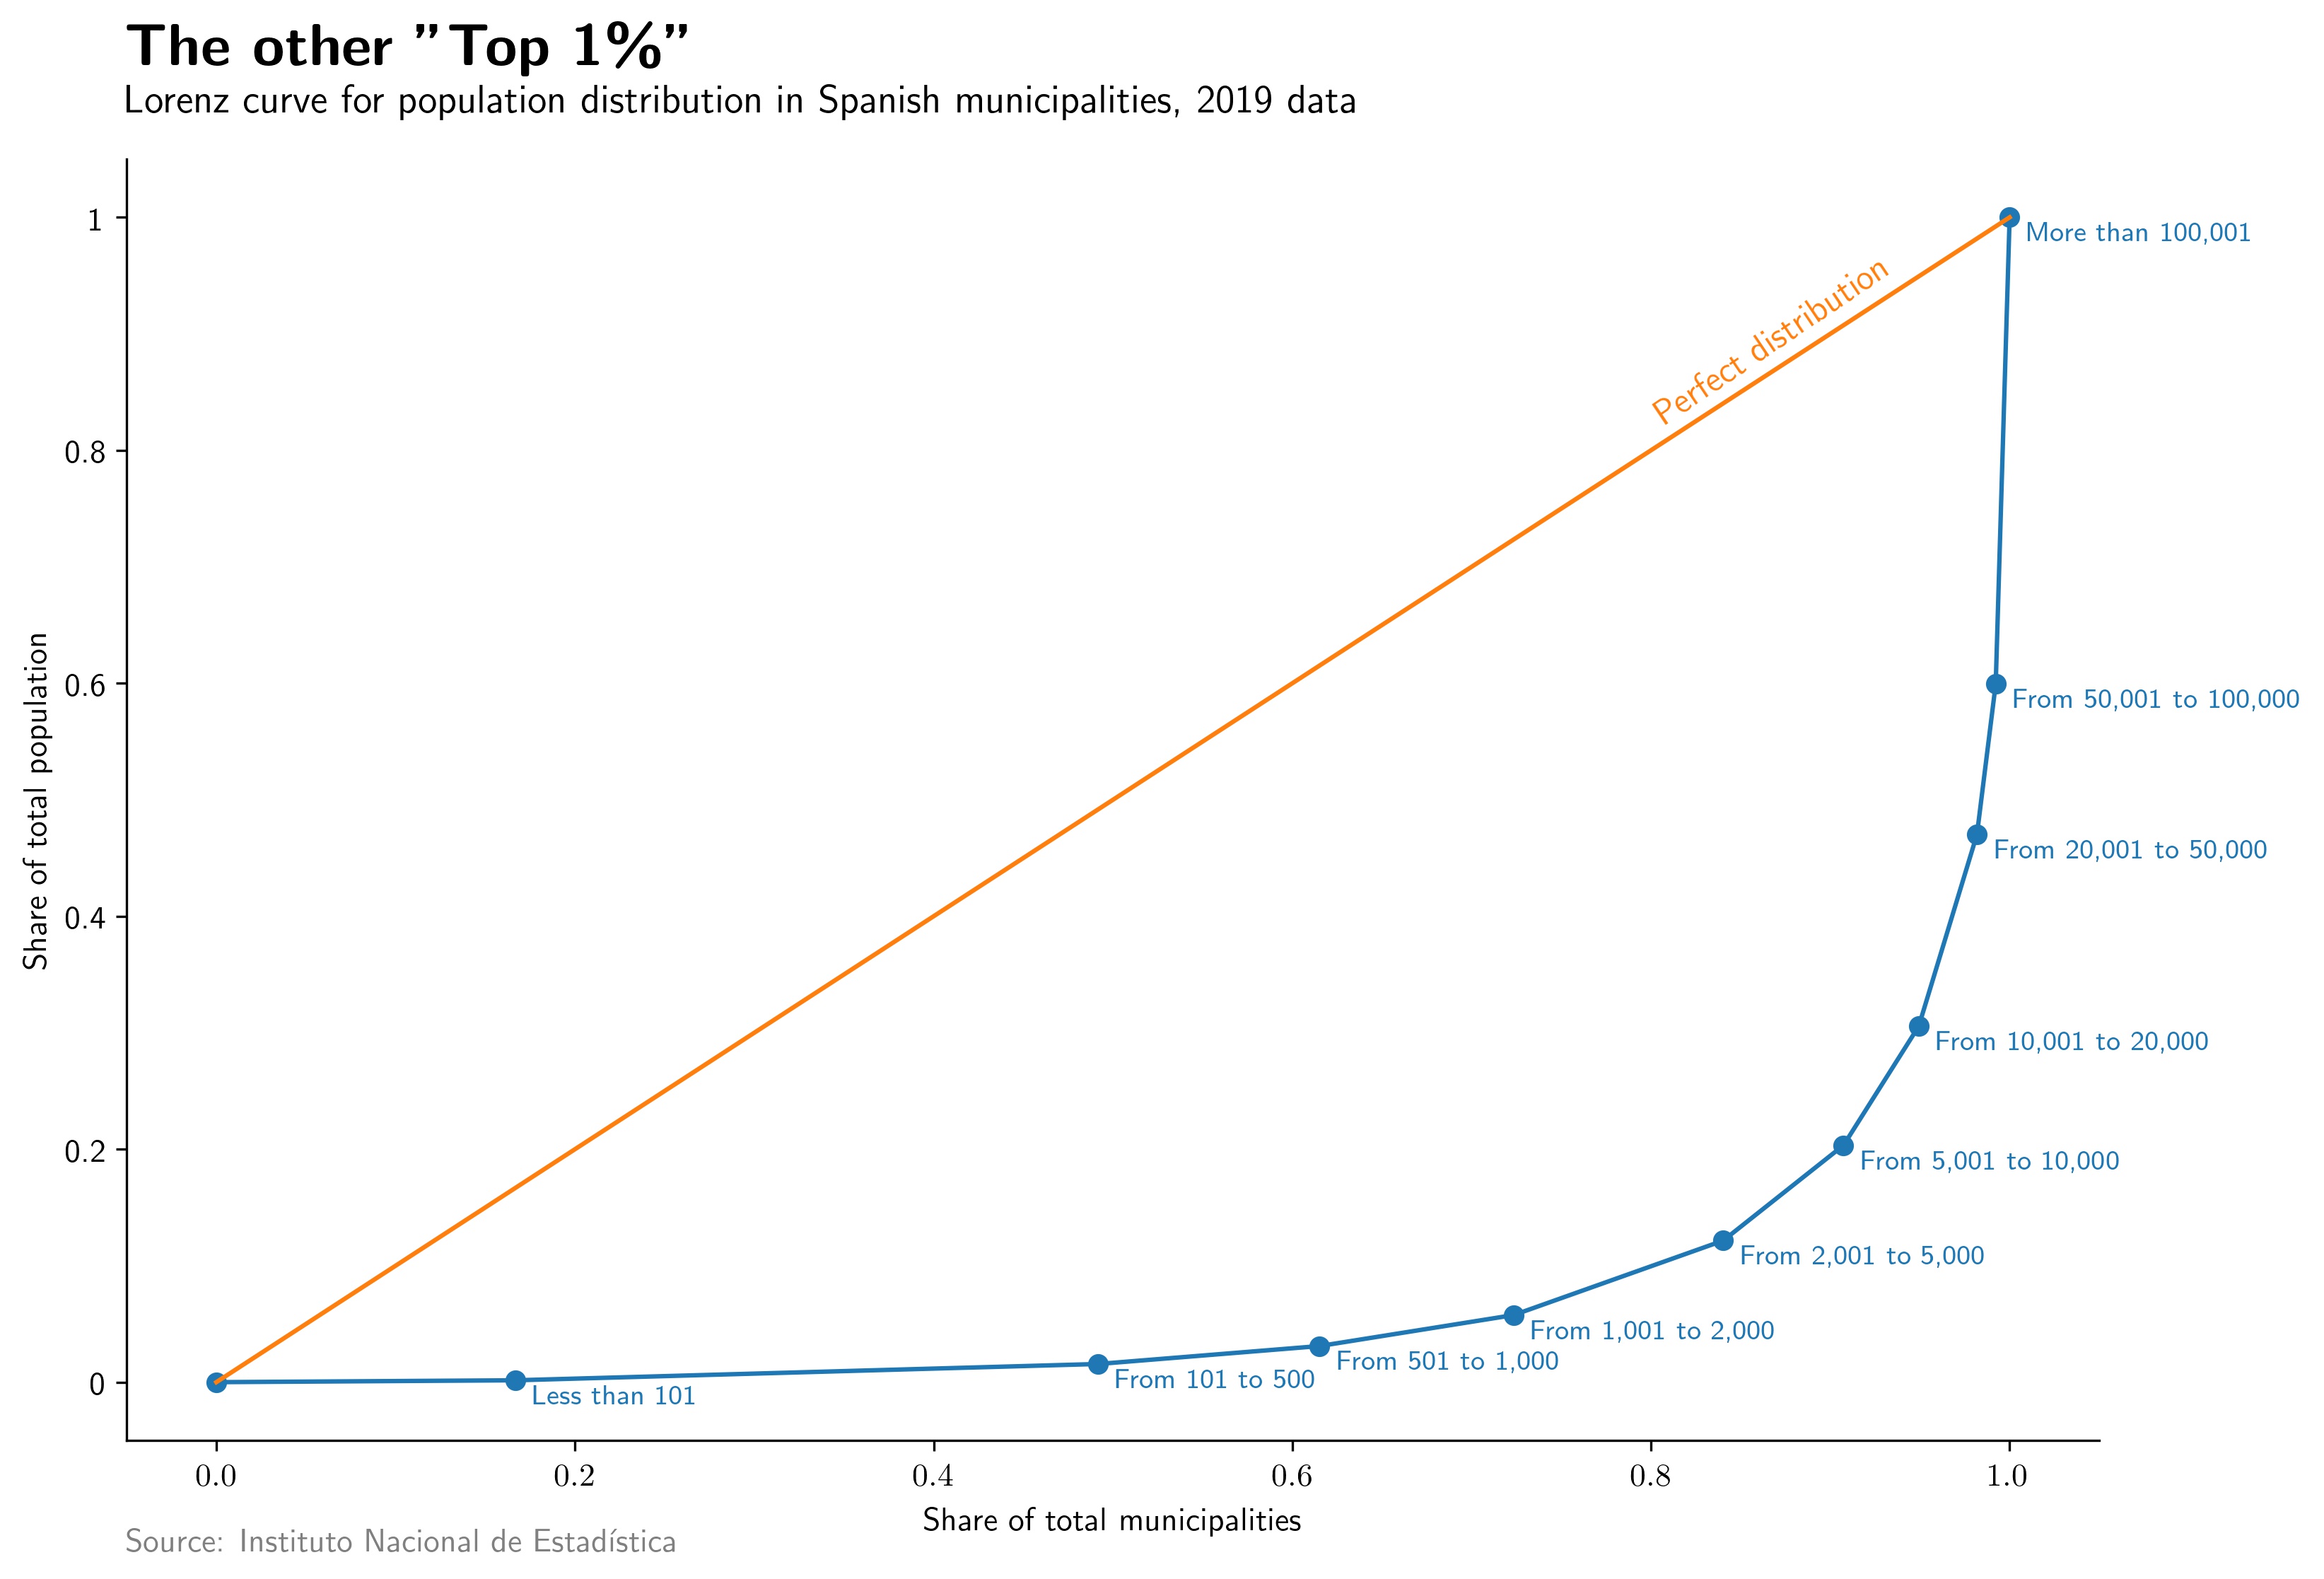
Out of a total of 8,300 Spanish towns and cities, more than 5,000 have less than 1,000 inhabitants. Around 84% of the Spanish municipalities have 5,000 or fewer people living, and a selected elite of 0.5% municipalities (Madrid, Barcelona and any large city with more than 100,000 inhabitants) represents 40% of the national population. The Gini index for that distribution is 0.70, which implies a huge inequality in terms of geographic concentration of the Spanish people. The Lorenz Curve shown by the figure is particularly far away from the «perfect distribution» benchmark, that is, a scenario in which each municipality has the same share of the total population. A detailed map reveals the same patterns identified in the previous calculations.
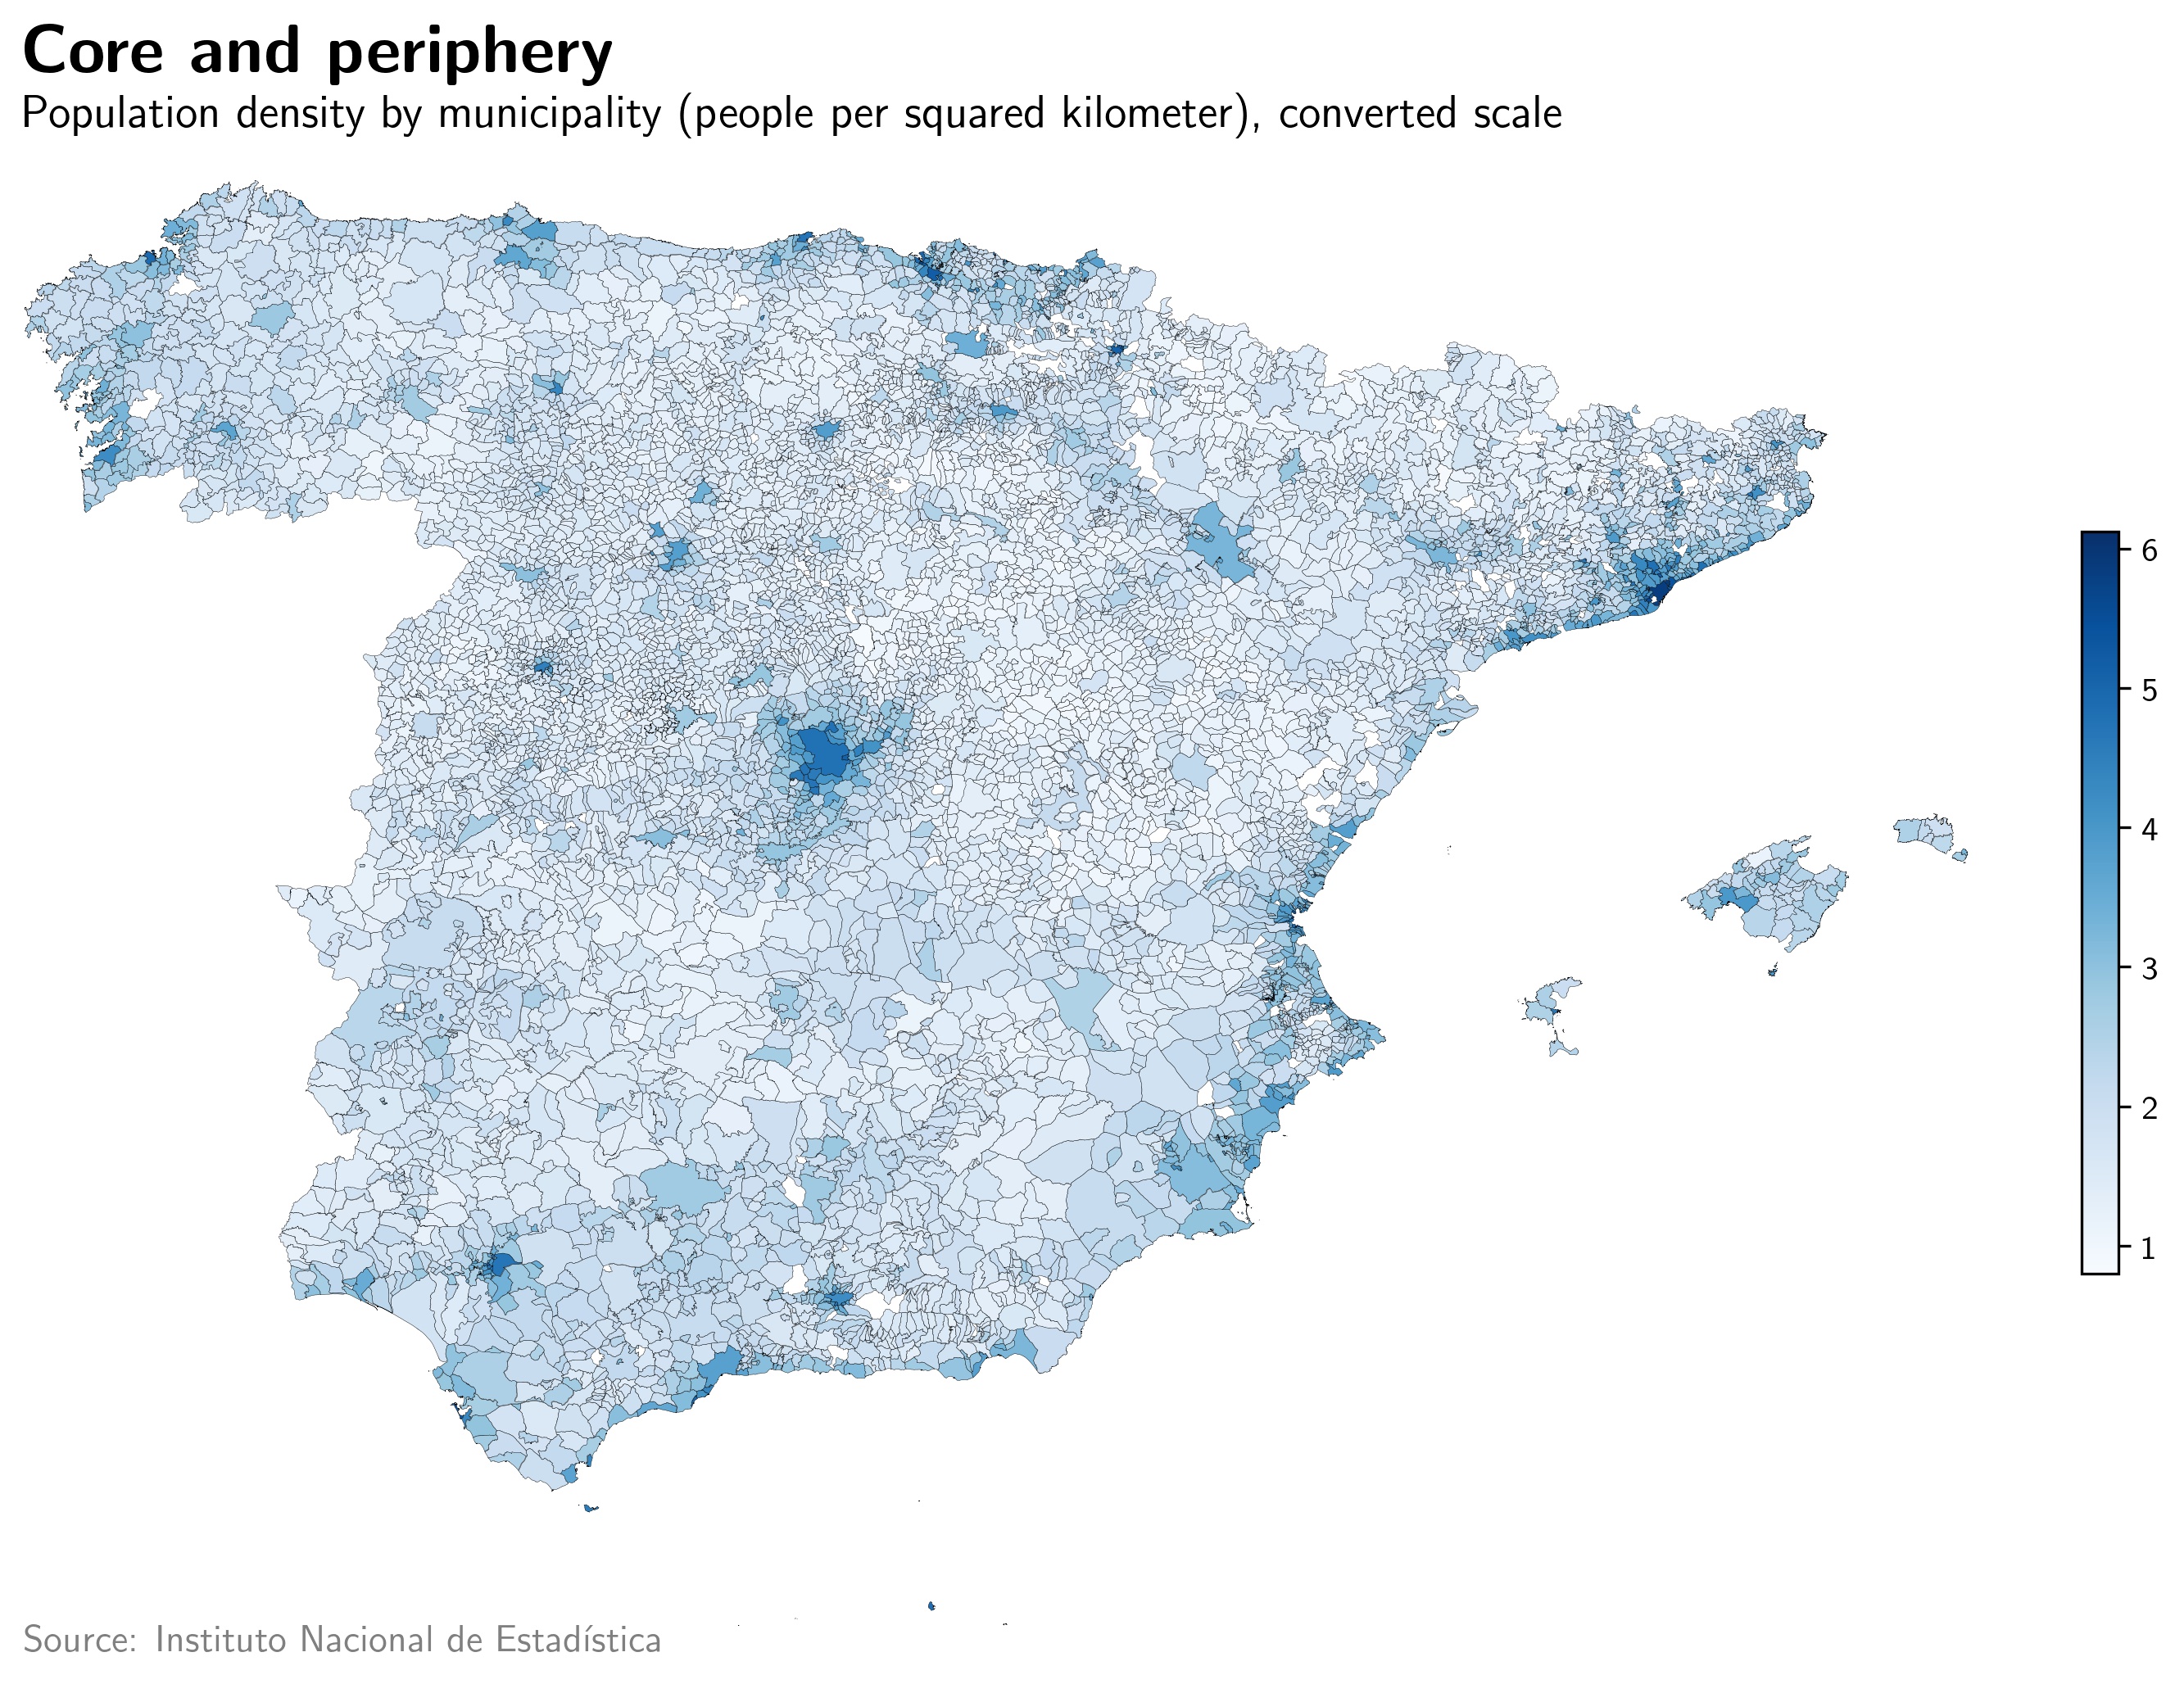
Spain is densely populated along its various coastlines but hardly inhabited in its rural core. With almost 21,500 people per squared kilometer, Hospitalet de Llobregat (in the Barcelona metro area) stands as the most densely populated city in the whole European Union. Barcelona itself has a 15,866 people per squared kilometer density, three times that of Madrid (5,418) or Sevilla (4,896). The Catalan litoral is the most densely populated region in Spain, but four other key areas are shaded in the map: the Valencia-Alicante coastline, the Costa del Sol region (which includes both Málaga and Almería), the Madrid metro area and the Northern part of País Vasco. Capital cities of major provinces such as Sevilla, Zaragoza, Granada or Coruña do also have high levels of population density, which contrast with the extremely low values observed in their surrounding municipalities.
The Spanish population in the remote past
This section offers some evidence on the long-run evolution of the Spanish population from approximately year 600BC to nowadays. It uses data from different fonts corresponding to various periods, which can be essentially divided in two: the pre-censual epoque (600 BC – 1850) and the modern censual epoque (1850 – 2000). For pre-censual times, we need to rely on population statistics for individual cities which conducted their citizenship controls rather than national aggregates, as the term “country” itself did not mean much at that time. Thus, it makes little sense to write about Spanish demographics in the 13th Century, but some conclusions can be drawn from Valencia, Córdoba or Barcelona’s population in the Middle and Modern Ages. After the introduction of the modern census in the mid-19th Century, the very concept of national statistics acquires a significant content and our scope can switch towards a Spanish aggregate perspective. For this second period, information on many relevant variables apart from strict population numbers appear and can be combined to derive key insights on the long-run evolution of the Spanish society, which are covered in a different section.
Population by cities
Southern Spain
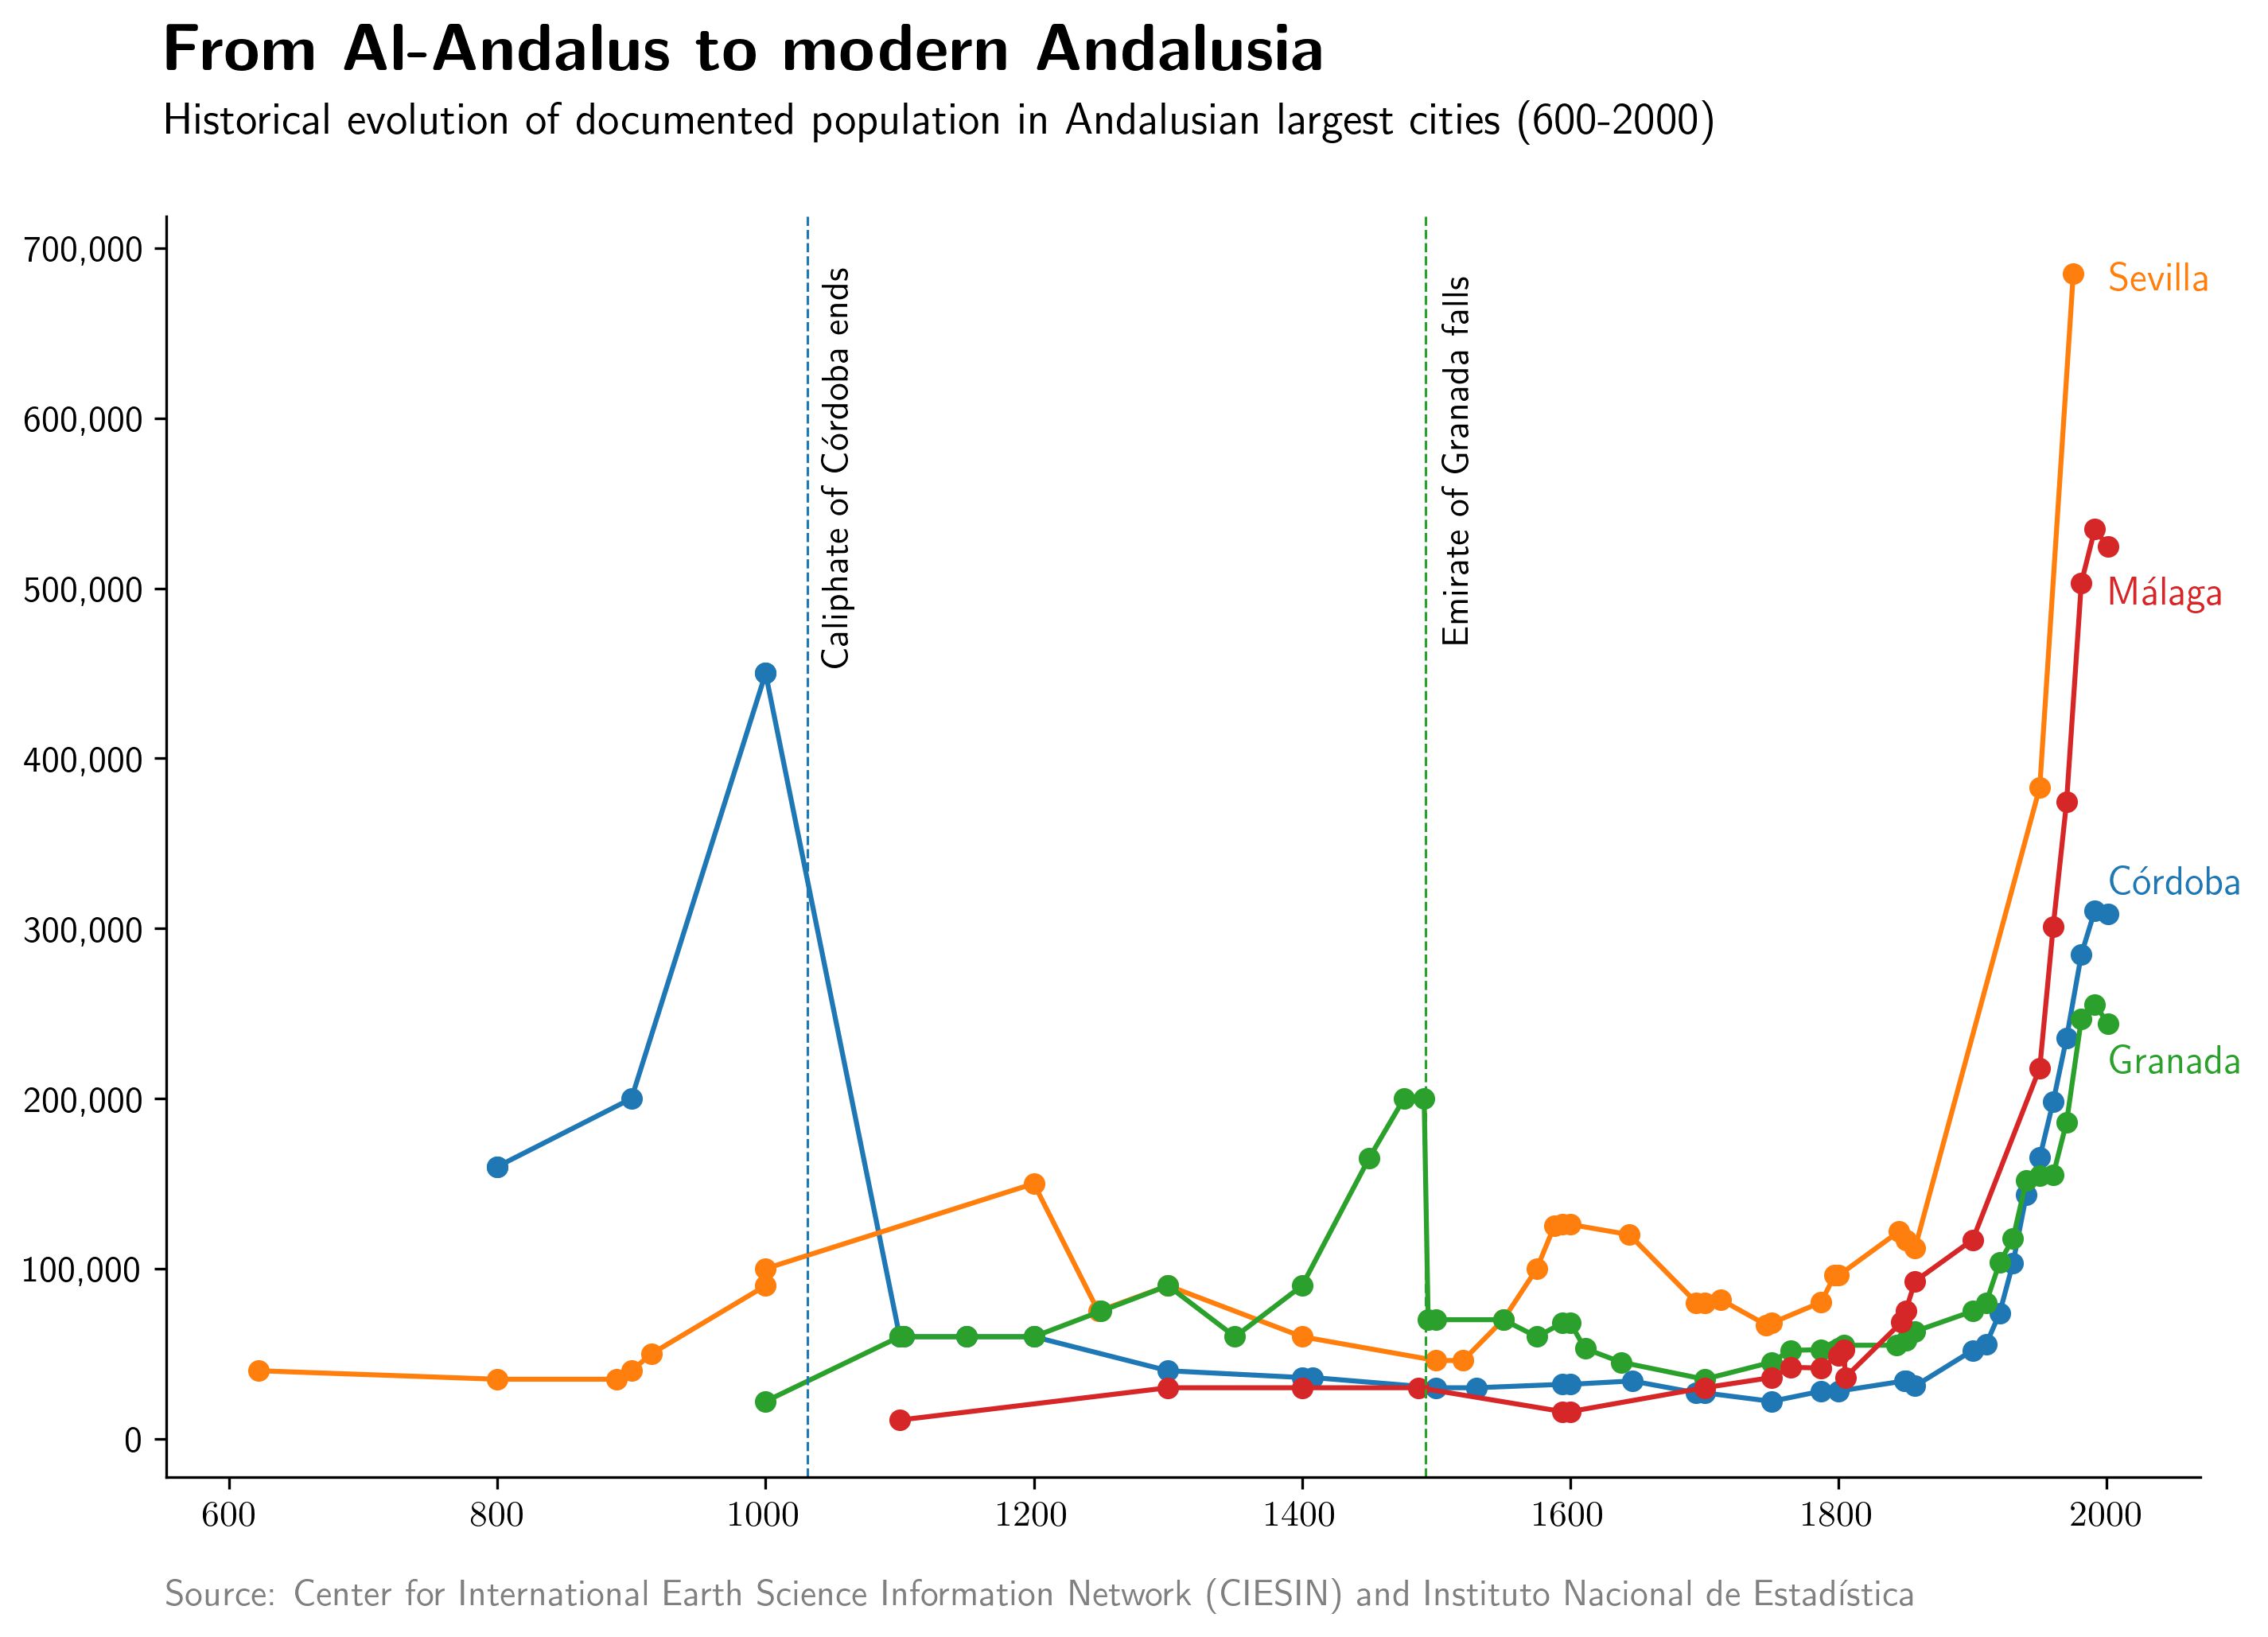
Population statistics for Al-Andalus cities (the Muslim southern states which existed between years 711 and 1492 BC) go back almost a millennia, hence providing a significant long-run perspective on their evolution. Demographics seem to be directly linked to political episodes involving changes in the specific territorial configuration of the Muslim reigns or emirates. At its greatest extent, the Caliphate of Córdoba had a capital city of almost 450,000 inhabitants, which Paris did not reach until 1750. After the fall of the Caliphate, the population rapidly decreased and remained at low numbers until the early 20th Century. Granada experienced a similar path. During the last decades before of Boabdil’s surrender, the city accumulated up to 200,000, inhabitors, becoming the largest city in the Iberian Peninsula at that time by far. Under the Catholic Kings’ occupancy, the population more than halved and kept decreasing for decades. Sevilla stands as a completely different case of study. As a Roman-founded city, it got an increasingly important role in Al-Andalus times until its fall to catholic armies in 1248, reaching population numbers close to 150,000 in 1200. However, the city experienced a rebirth after the discovery of America, as it became an effective commercial and logistical center of new international trade routes.
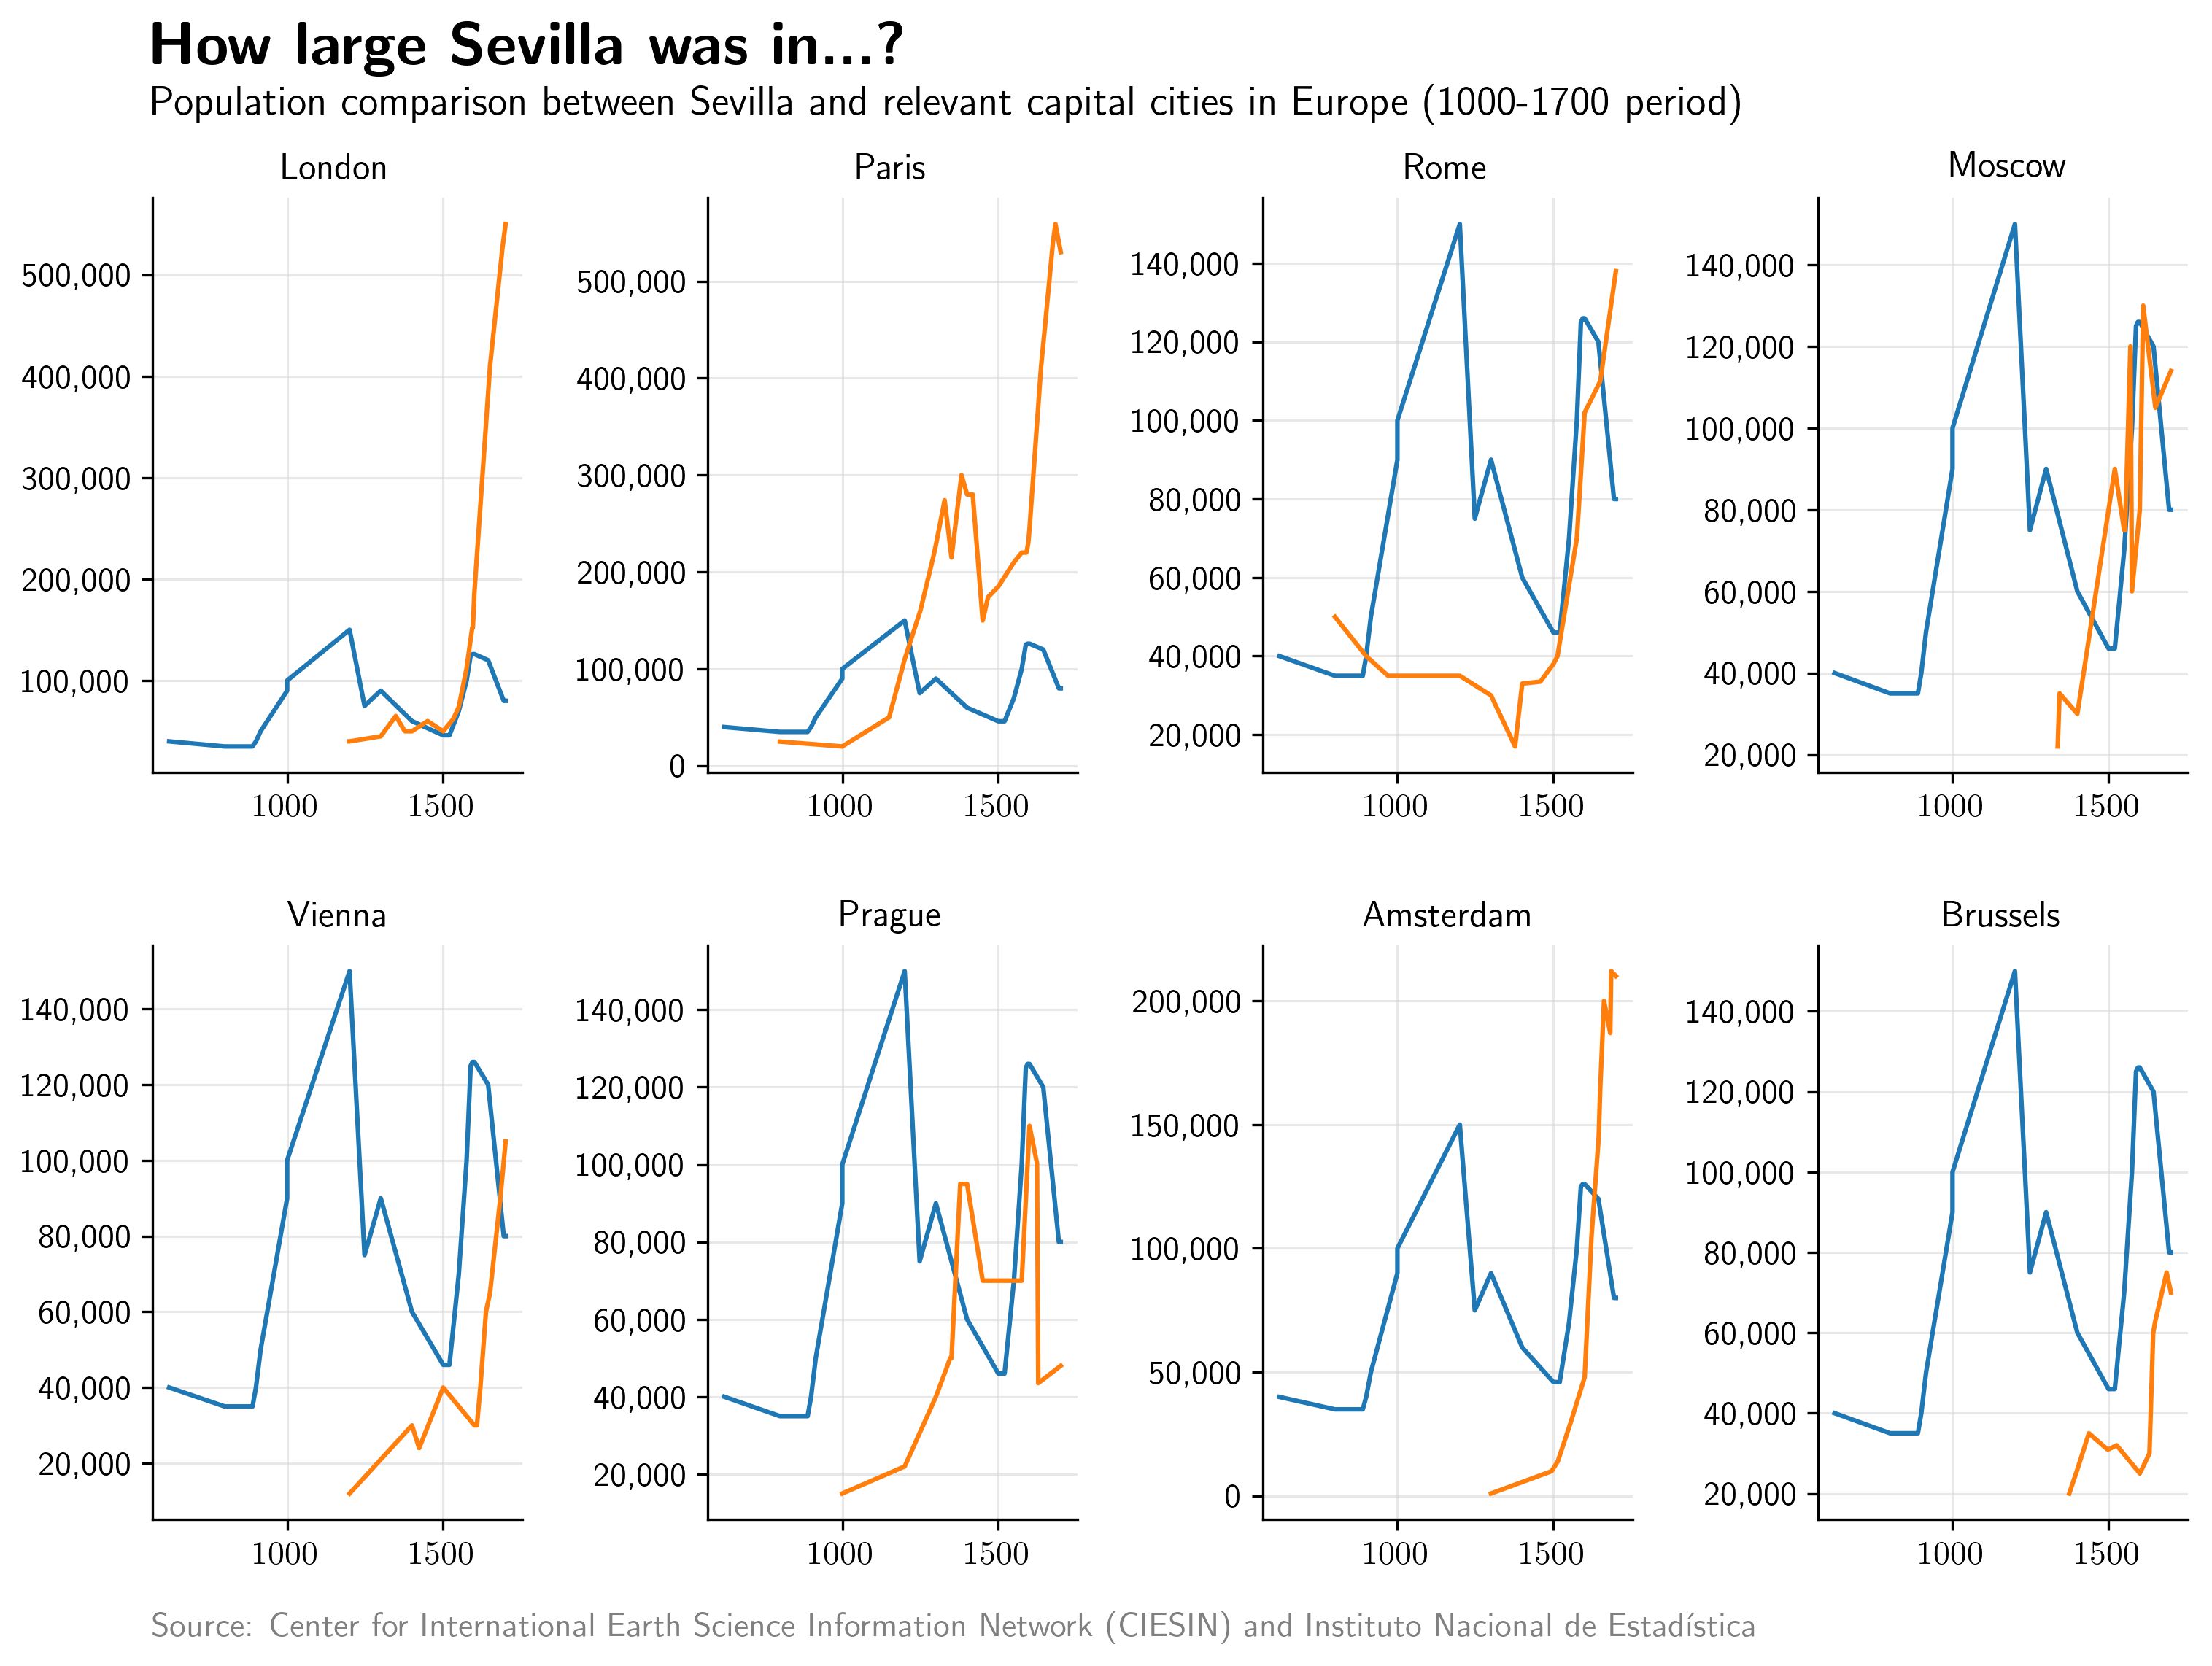
This figure provides a comparative approach of the real size of Sevilla during the Middle and Modern Ages in two different ways: by showing the antiquity of available data and the relative population numbers. Out of the 8 European capital cities compared, only Rome’s demographics date back earlier than the Andalusian city. Until 1250, Sevilla was larger than any of the chosen capitals, when it got overtaken by Paris. It took 250 years more for London and Moscow to equate its population, which was still larger than Amsterdam’s or Vienna’s. Along the 16th Century, Sevilla caught up London, Rome, and Prague again, but got definitely left behind around 1700, when its demographics had taken a strong decreasing path.
Mediterranean Spain

A second key entity of early «Spain» was the Crown of Aragón, which occupied the North and Eastern part of the Peninsula (and several South European enclaves such as Naples or Corsica). Demographics on its most relevant cities date back to 1000 BC and, oppositely to Al-Andalus territories, did not experience noticeable growth until their catholic recovery. Valencia, which for many centuries stood as the coastal largest city in Spain, started developing after King Jaume I conquest and became a major Mediterranean trade location until the discovery of America, which implied a radical shift of commercial routes. The city demographic explosion came during the Industrial Revolution decades when it outpaced other important Spanish cities including Barcelona.
Palma (Mallorca) and Murcia followed similar paths. After being incorporated to the Crown of Aragon, they maintained stable population numbers around 30,000 inhabitors until 1850, when they were chosen as regional capitals and got industrialized (and, in the case of Murcia, connected to national railway lines). On the other hand, Zaragoza (today’s capital of Aragón region) rapidly grew due to its privileged location between Barcelona and Madrid, hence benefiting from their commercial flows. Nowadays, it ranks as the fifth most populous city in Spain with over 600,000 inhabitants.
Central Spain

The last key territorial element in Middle Age Spain was the Crown of Castilla, occupying the Central and South-Eastern Peninsula territories. The key common feature of Castillian urban centers is they were victims of Madrid’s macrocephalia, that is, their demographic expansion was abruptly interrupted by the rise of Madrid as a national capital. Toledo and Valladolid both served as capital cities during the times of the Crown of Castilla and the early years of modern Spain. The wedding between Isabel de Castilla and Fernando de Aragón in 1469 took place in Valladolid, and they reigned from the city of Toledo. By 1550, both cities had a population of 60,000 and 75,000 respectively, which made them the largest non-Muslim urban centers in the country. However, the decision of King Felipe II to establish the Imperial capital in the unknown city of Madrid soon ended their demographic projections. In 50 years, they lost around 50,000 inhabitors each and did not recover their population numbers until the Industrial Revolution (Valladolid) or even the year 2000 (Toledo).
Salamanca was home to the third oldest European University, founded in 1218, which developed a major thought school «La Escuela de Salamanca» in the 16th Century, attracting many students from anywhere in Spain. After its 25,000 population peak in 1600, the city was also punished by Madrid’s growth and remains a minor urban center still nowadays. In the centuries before the Castillian unification under the Crown of Castille, the North-Eastern city of Burgos served as the capital city of the Kingdom of Castille, holding several political events and Court meetings. After Toledo was recovered from its Muslim occupation, the city started losing political relevance but did not stop its population growth, which reached a high of 35,000 in the early 15th Century. From then on, it rapidly lost almost all its inhabitors in favor of the new capital city of Madrid.
Madrid and Barcelona
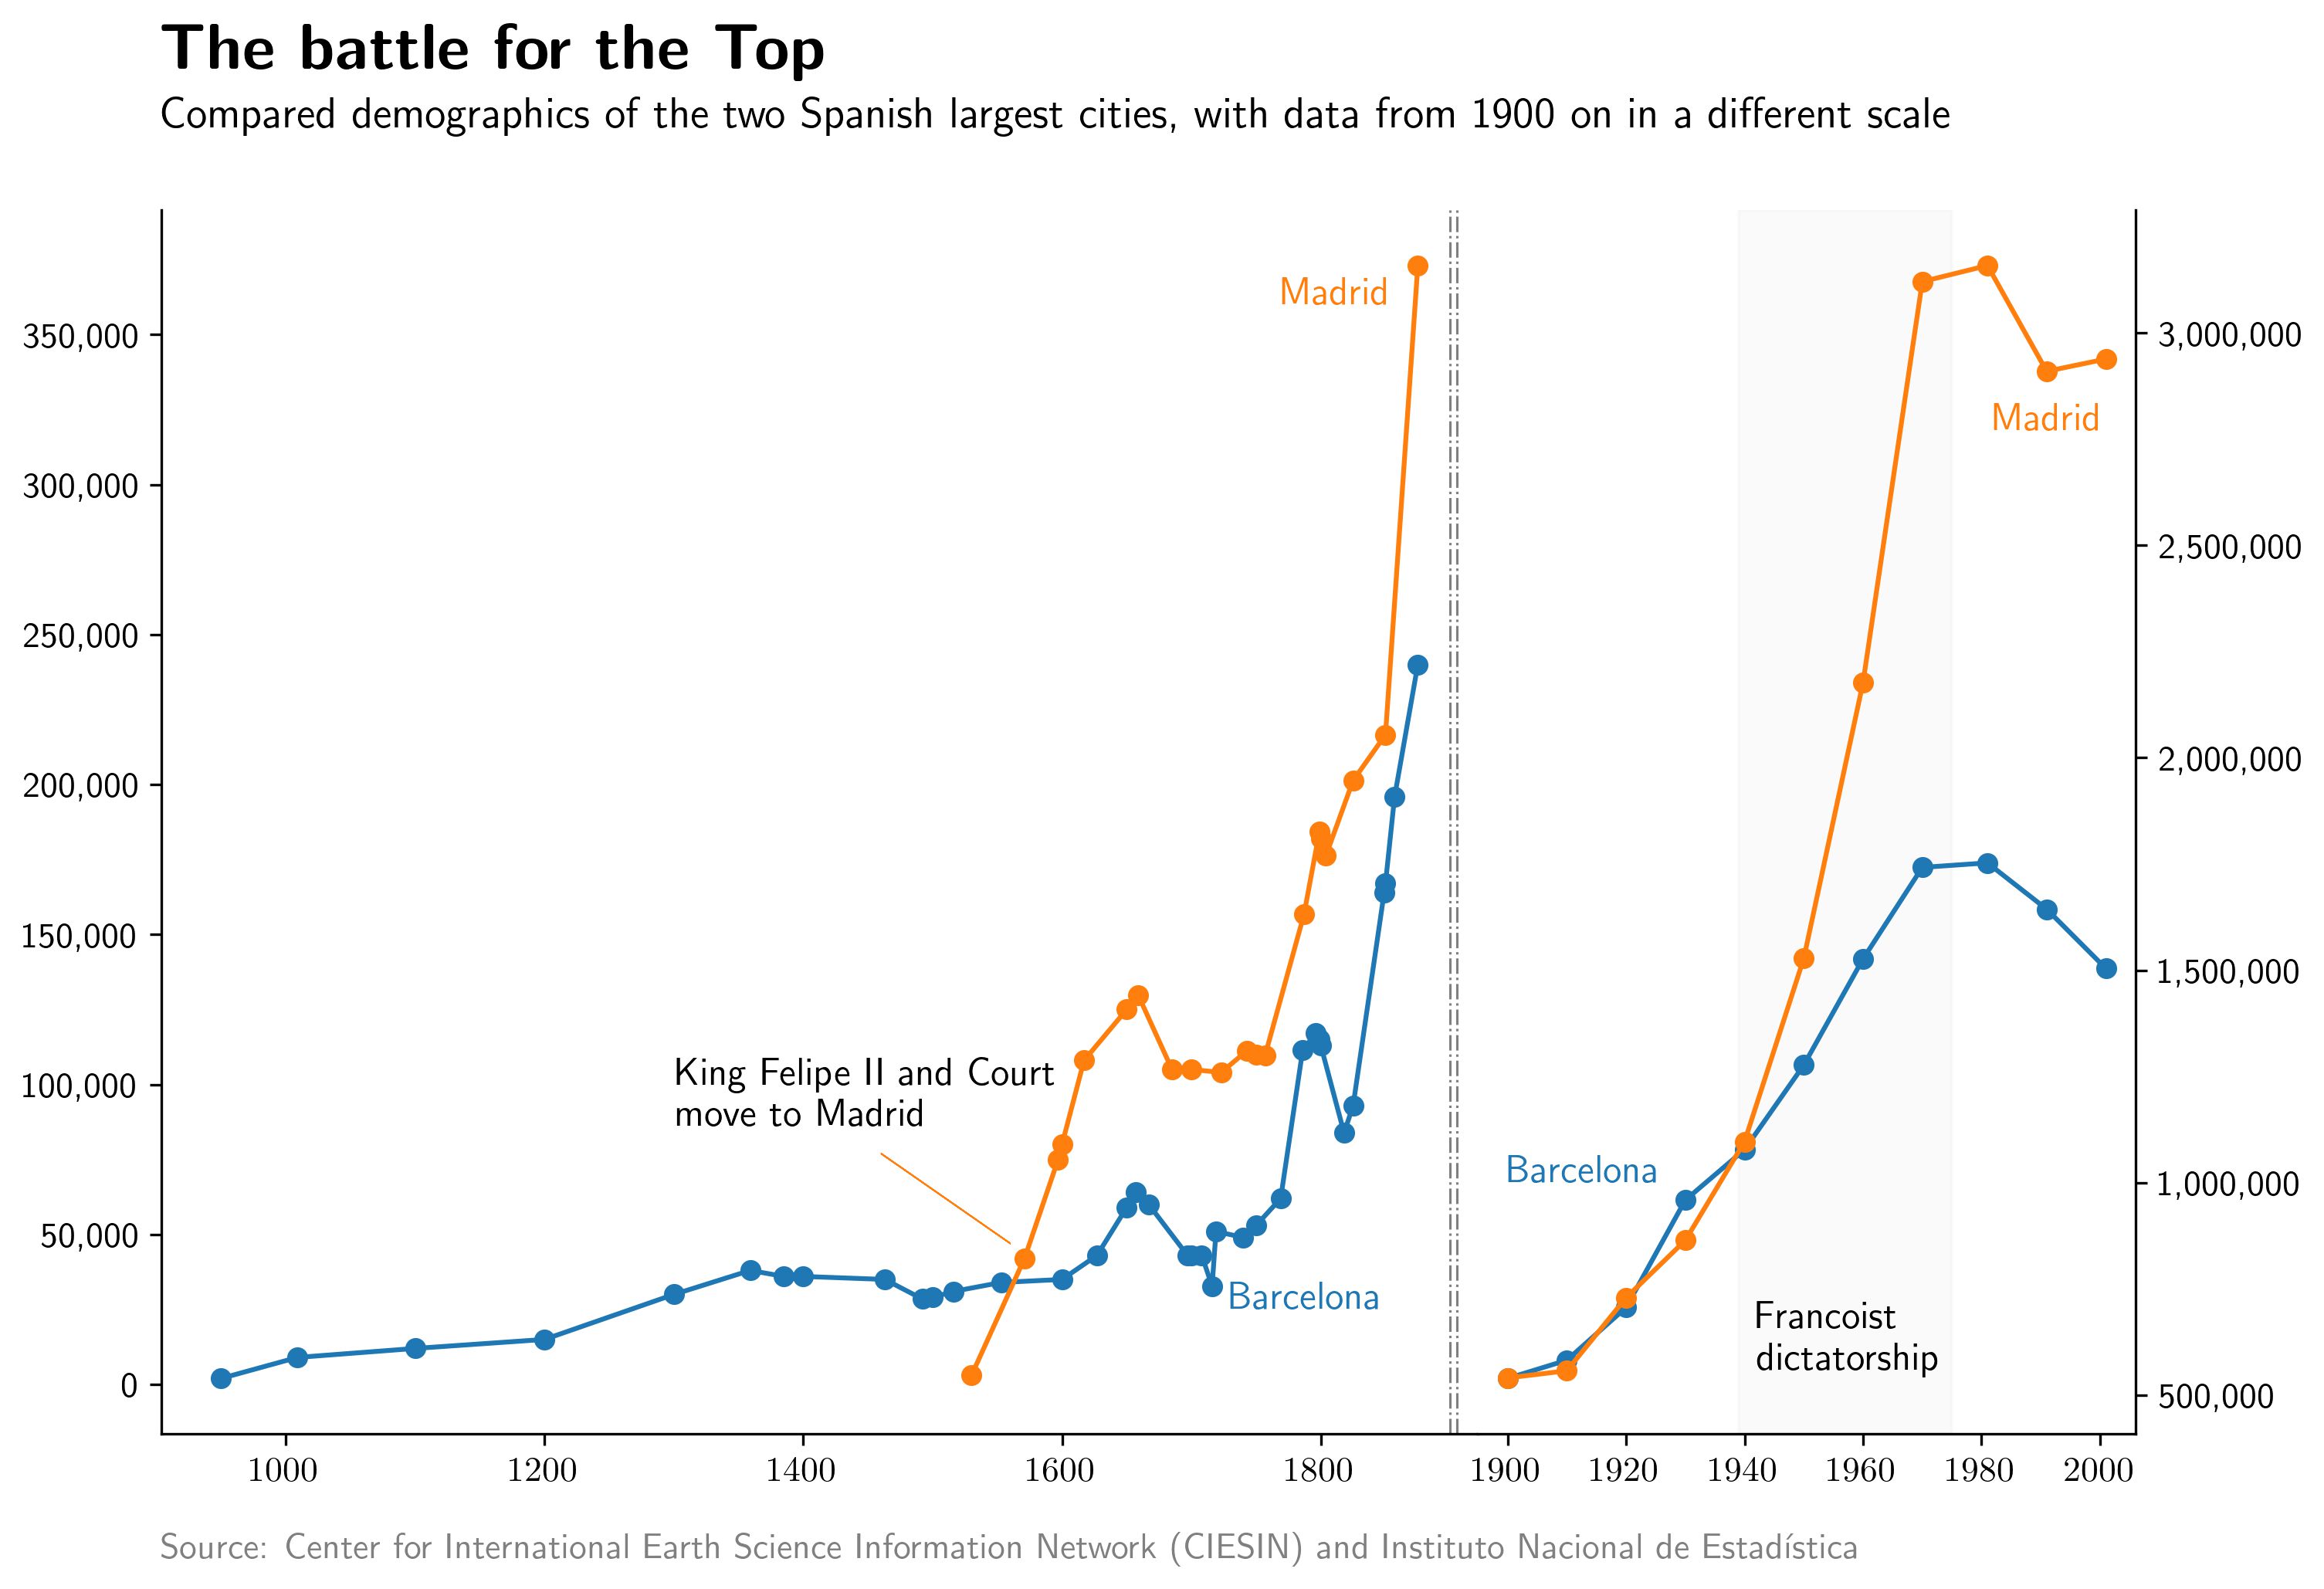
Madrid and Barcelona are the two largest cities in Spain, with around 3.2M and 1.5M inhabitors in 2018, respectively. Madrid was an almost unknown location with 1,000 inhabitors in Central Spain until King Felipe II chose it as the capital of his Empire in the late 16th Century. During the brightest days of the Spanish overseas domination, the city’s population rapidly rose to 150,000 in 50 years, slightly behind that of Sevilla’s. The centralist French view of the State brought by the Borbons (which accessed the Spanish throne after the War of Spanish Succession of 1713) contributed to further growth, especially during the reign of King Carlos III, «El Mejor Alcalde de Madrid». On the other hand, the growth path of Barcelona remained much more constant over time, starting from almost the year 1000 BC. The city was not the commercial capital it is today (as that role was played by Valencia), so it did not suffer relevant shocks due to the shift of commercial routes in the 16th Century. The radical change came with the Industrial Revolution, which started in the Northern regions of Cataluña and Euskadi. The industry generated a wealthy bourgeoisie which financed the rapid development of the city of Barcelona during the second half of the 19th Century.
By the beginning of the 20th Century, both cities were already leading the Spanish demographic race with half-million population each. In the early years before the Spanish Civil War, Barcelona slightly passed Madrid in terms of inhabitors, mainly due to the weight of its industrial sector. However, after the end of the conflict and the establishment of the Francoist Dictatorship, Madrid soon left the Mediterranean city behind by more than doubling its size.
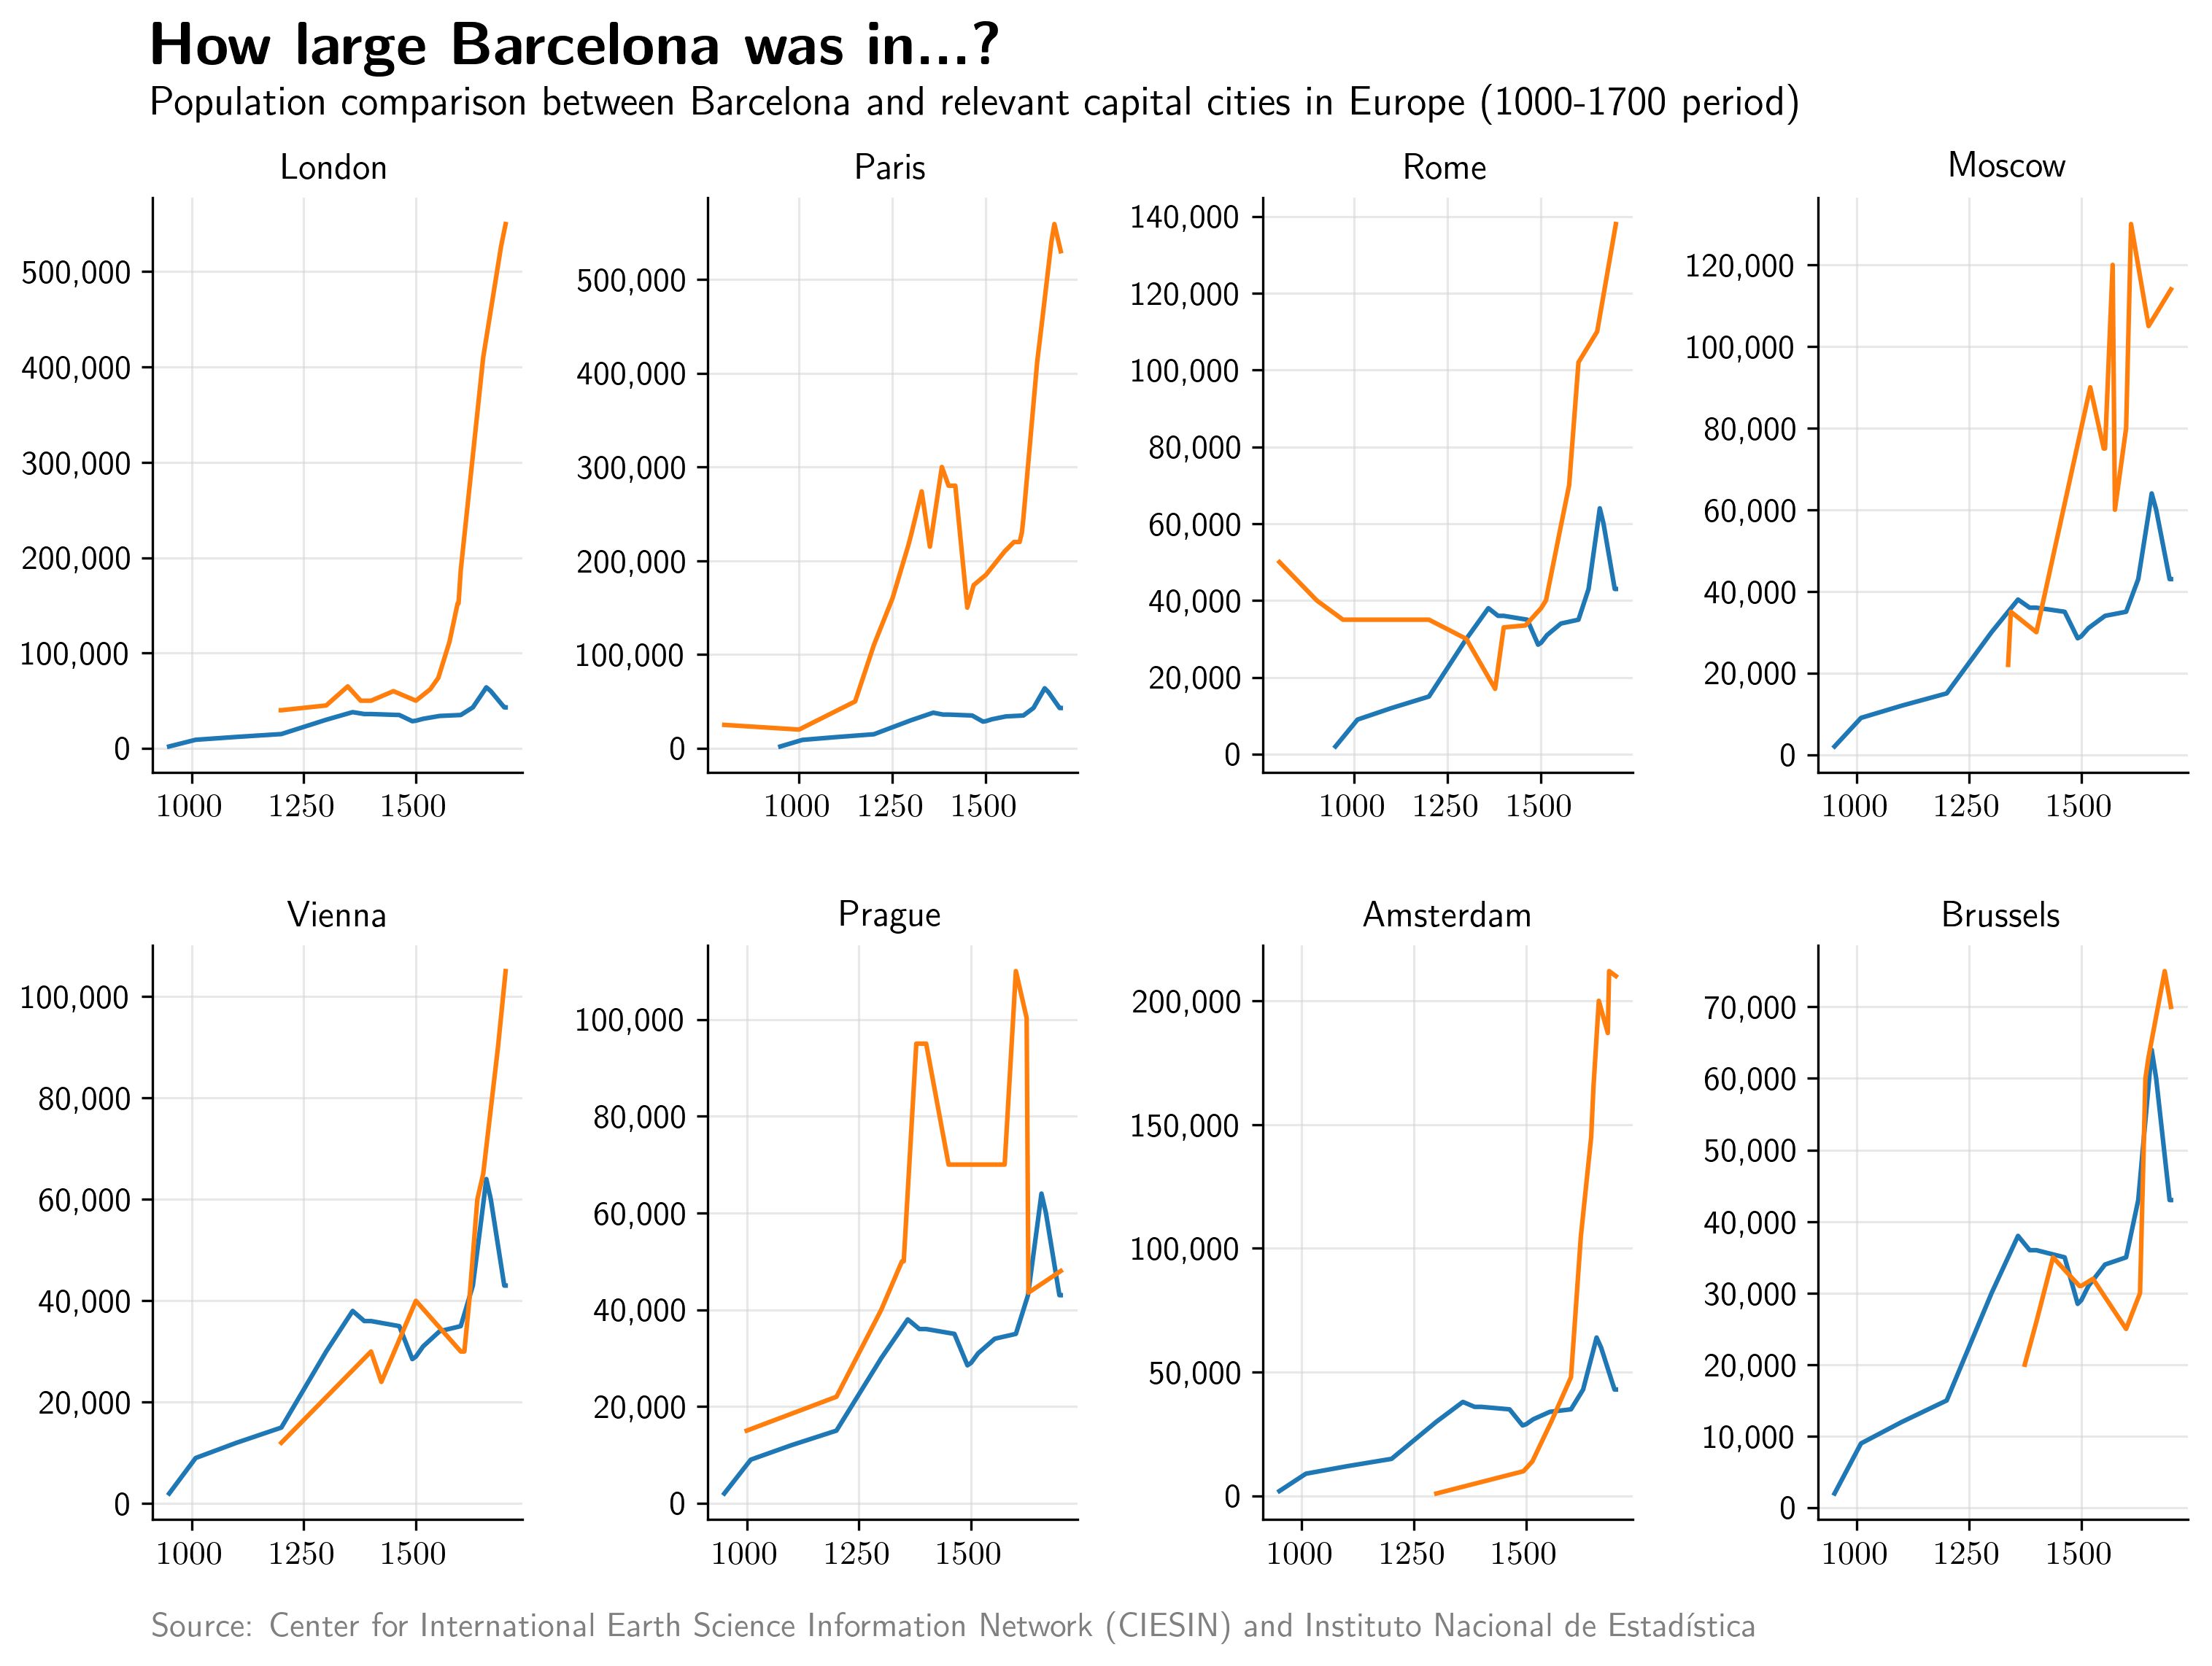
One of the most remarkable facts of Spanish long-run demographics is that today’s metropolis do not coincide with the country’s historically major cities. An easy way to visualize that thesis is to reproduce the comparison between Sevilla and 8 major capital cities focusing on Barcelona (the exercise cannot be done with Madrid because it simply did not exist at that time). Between the years 1000 and 1700, the Catalan capital was smaller at any time than London, Paris, Prague, and Rome (with a brief exception of the 14th Century). It was rapidly outpaced by Moscow in 1300 and Amsterdam or Vienna in the 17th Century. Its population peak in those 700 years was of 60,000 inhabitors, half the population Córdoba had in year 800 BC. That effectively confirms Barcelona has not always been a major European center and also explains much of the strong industrial component of the city nowadays.
Imperial Spain
Between the years 1492 and 1850 (approximately), Spain occupied most of the Latin America territory, as well as some Caribean and overseas islands such as Cuba or the Philippines. Some of those lands were already occupied by local empires (i.e. Mexico or Perú), but most of them remained virgin and unexplored at that time. Through the Virreinato territorial division, Spaniards managed to control a huge extension of land from key urban locations, which ultimately became national capitals after independence regional movements in the first half of the 19th Century. This figure shows how local demographics evolved through that period, with two major exceptions: Mexico City and Manila, which are treated separately.
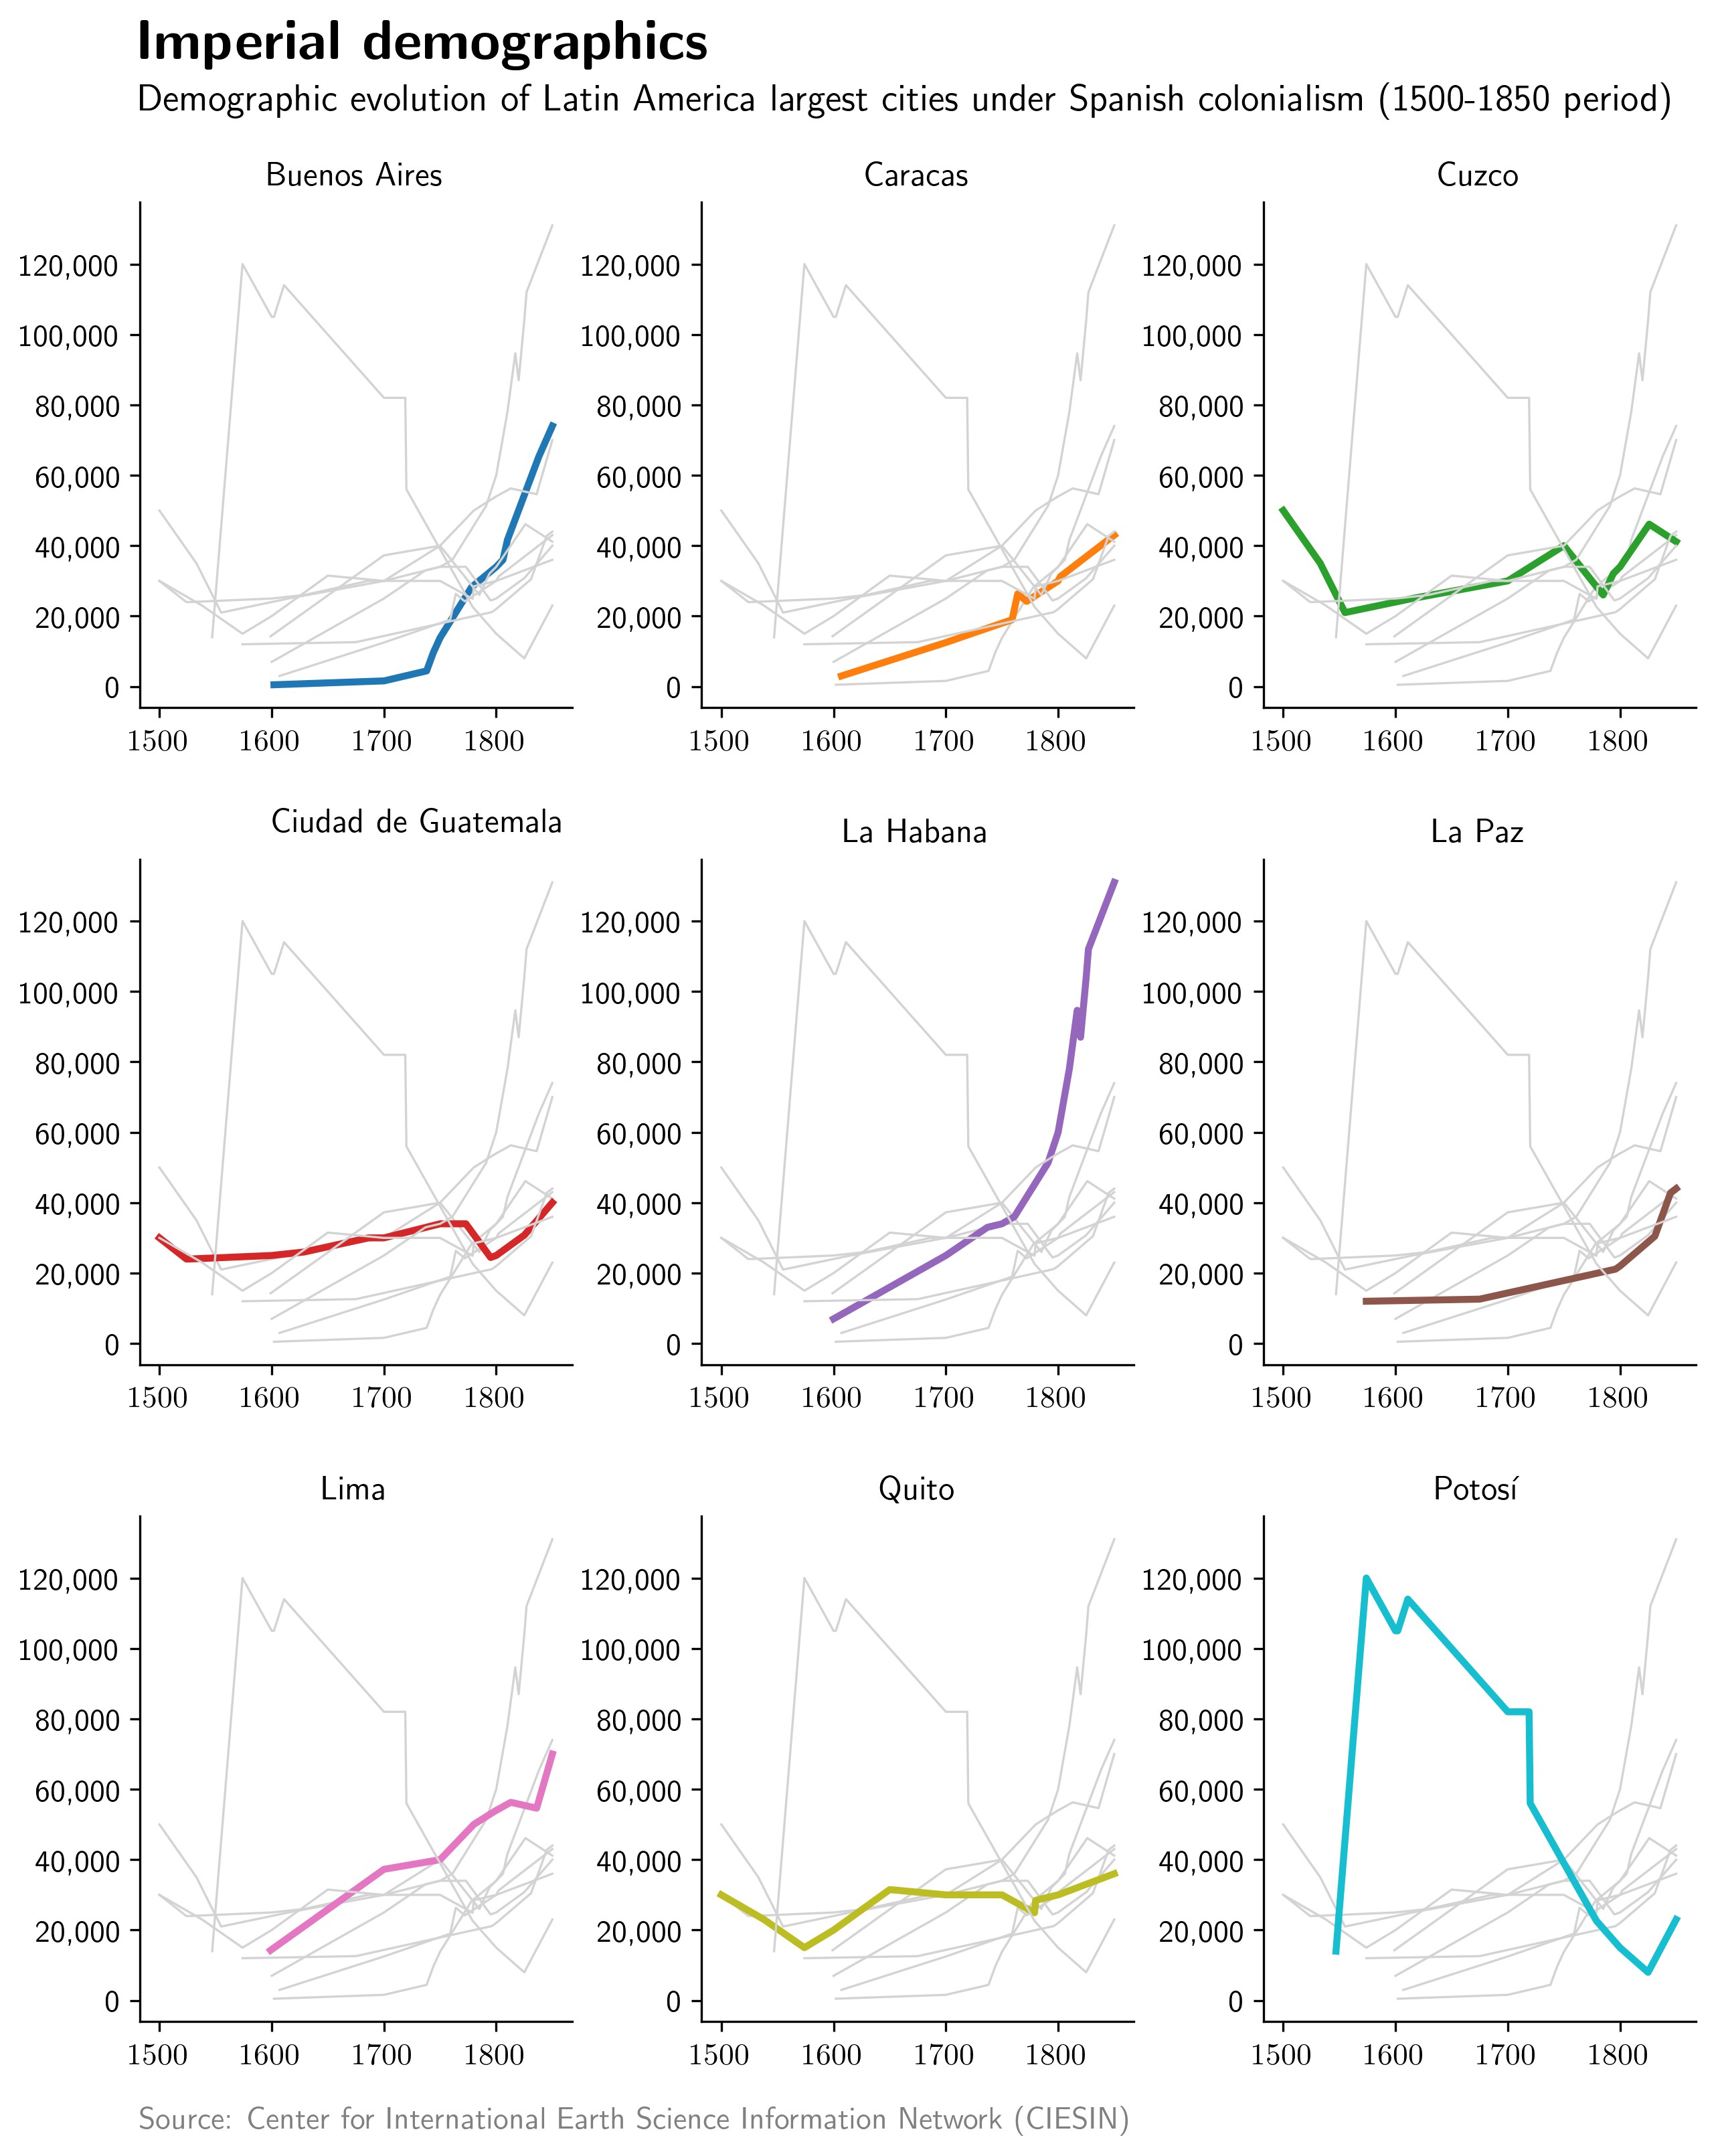
The largest city in the Spanish overseas Empire was La Habana, founded by early conquerors in 1514 as a local commercial base. Its privileged position made it the victim of several pirate attacks for decades but also attracted many inhabitors from continental Spain. By the time independence movements began (around 1800), La Habana’s population had already reached 100,000 and living standards were particularly high due to the slavery sugar-exploitation economic structure. Its demographic expansion continued until the Cuban island was definitely lost to the US in the Spanish-American War of 1898. On the contrary, Potosí (a minor location in today’s Bolivia) experienced an inverted path. Its abundant silver mines concentrated most of the economic activity in the South-American area during the first centuries of colonial occupation. By the year 1600, the village had around 120,000 inhabitors, twice the population of Madrid at that time. However, when large extraction tasks ended in the 18th Century, the city suffered a rapid decline in both population and relevance. Regarding other major Imperial cities, two diverging paths appear. They either existed before the arrival of the Spanish, in which case they initially reduce their population as a result of military conflicts and then recover their early size (such as Cuzco in Perú), or they were founded by Spanish colonizers, following an upward demographic trend up to a maximum of 60,000 inhabitants by the time of their independence (such as Caracas in Venezuela).
Population at a national scale
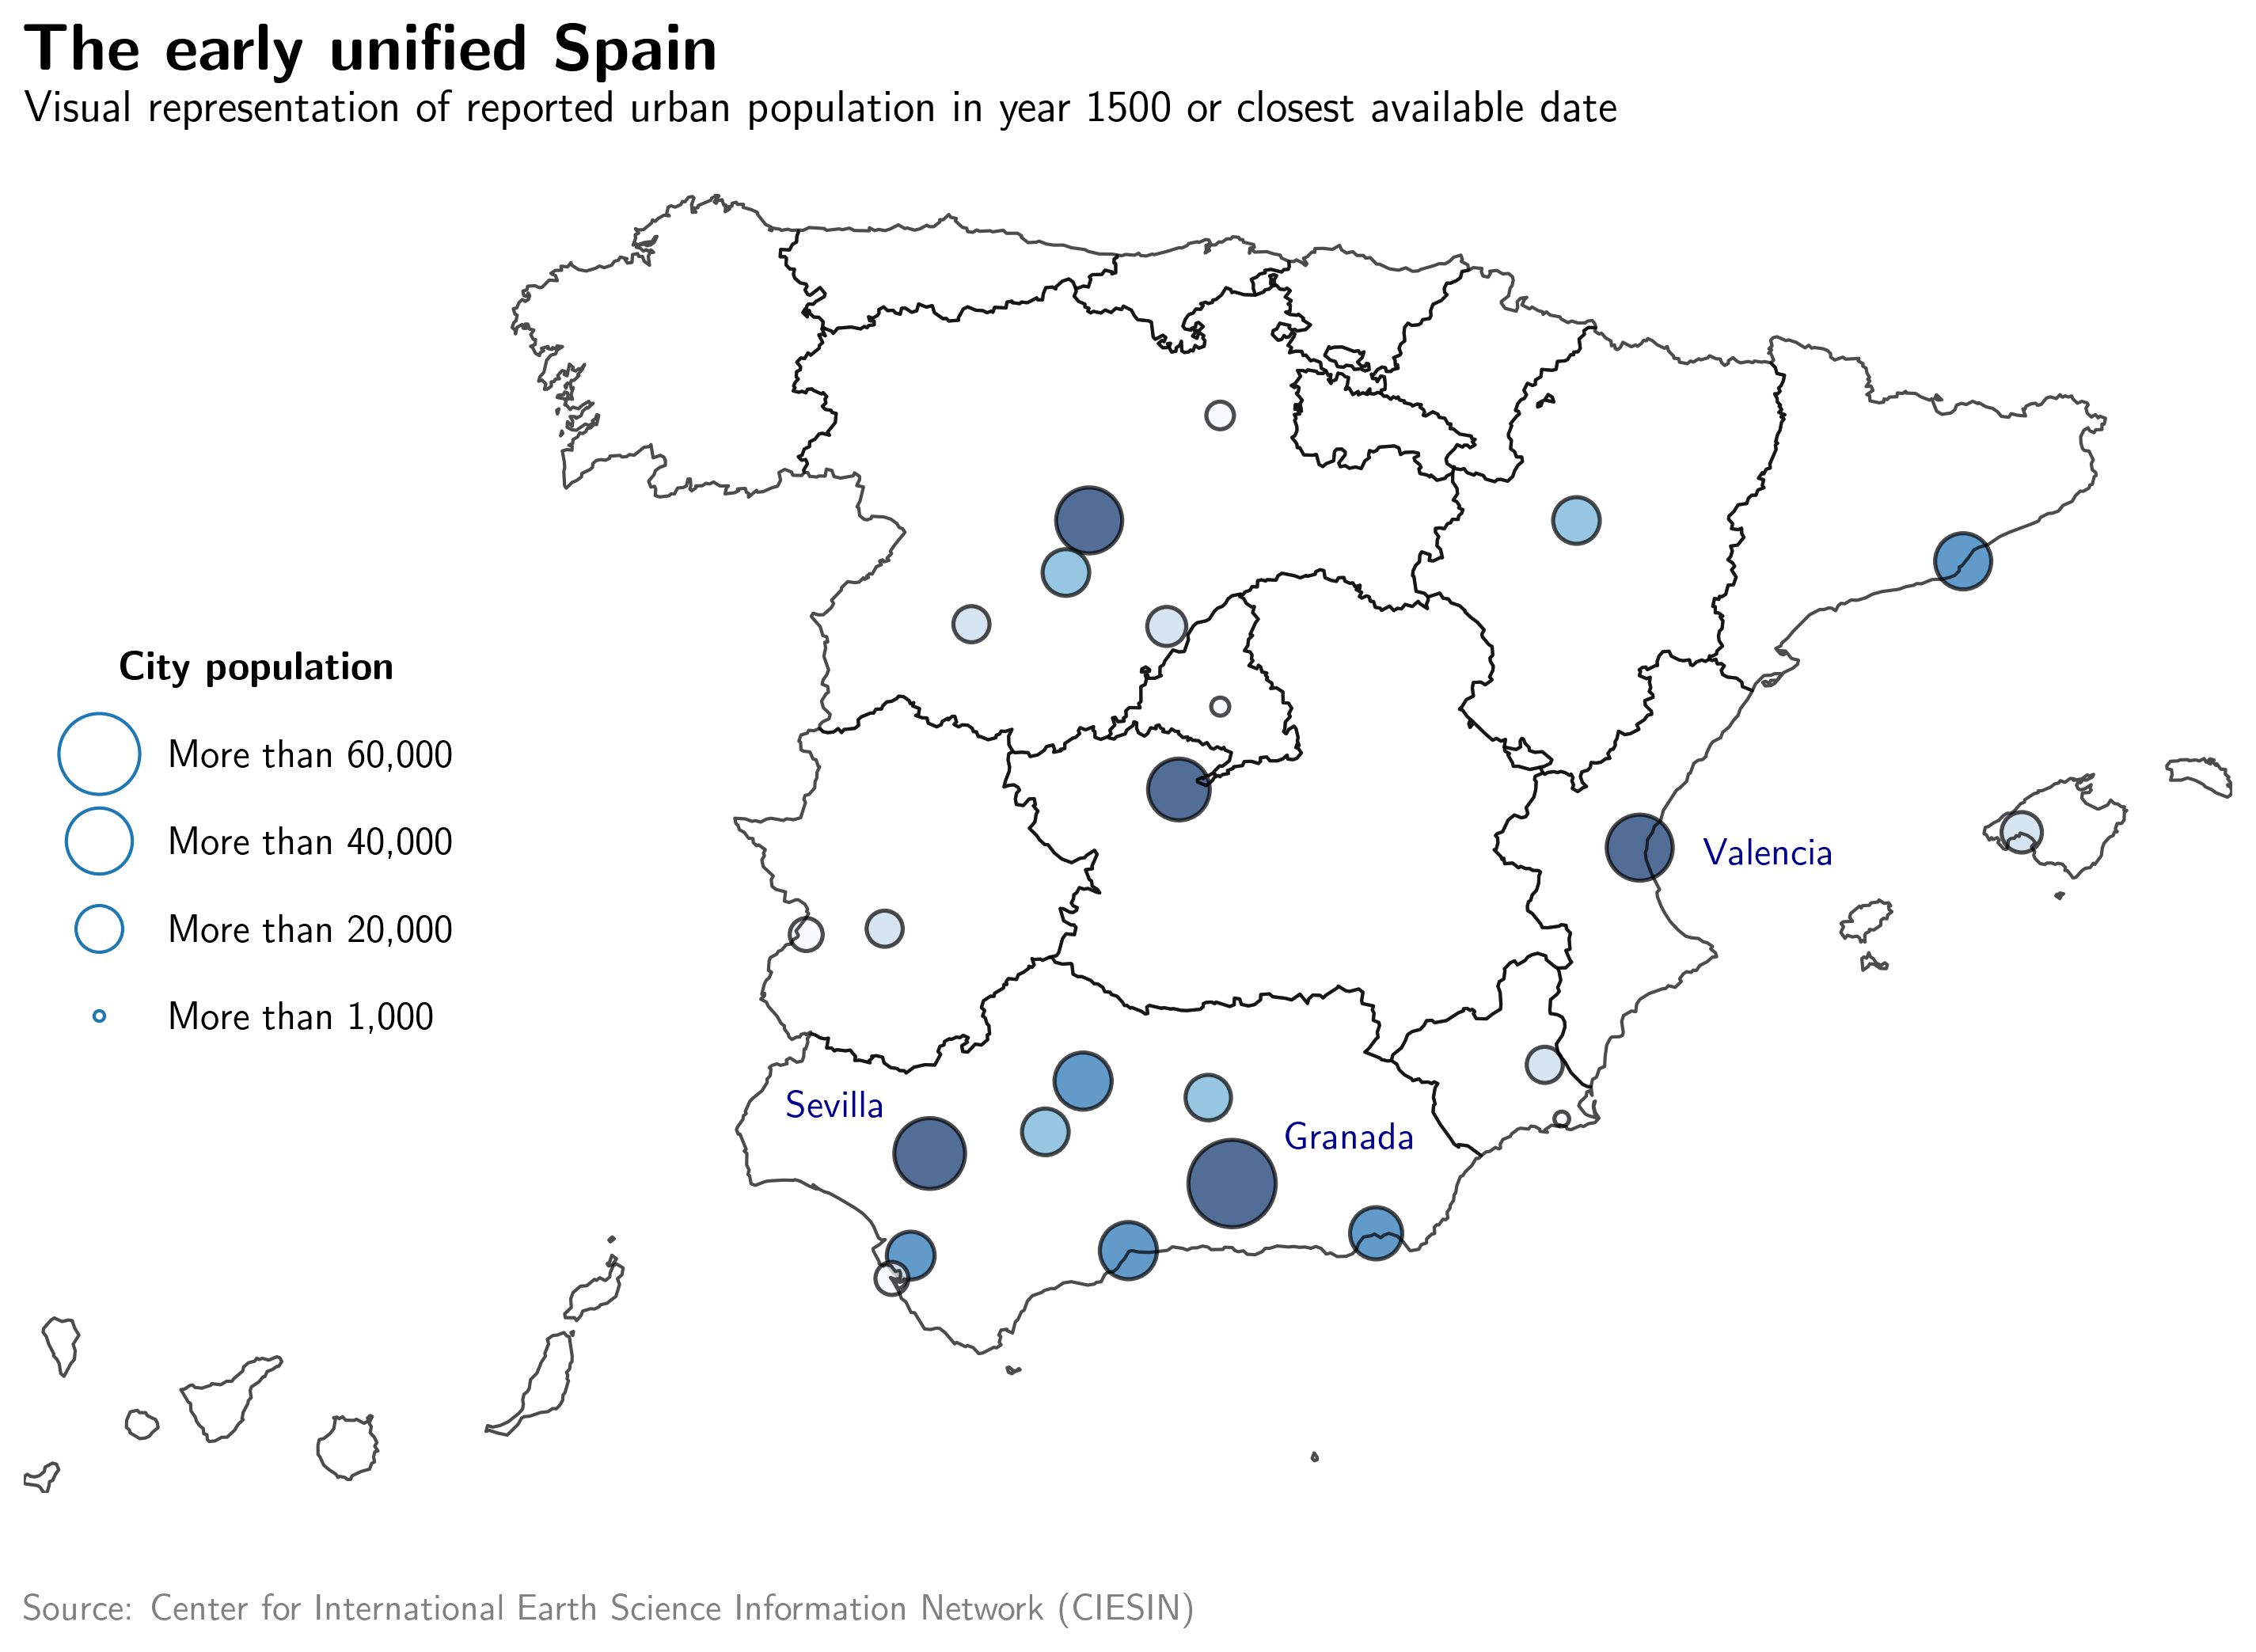
As stated before, when dealing with historical population statistics it is relevant to avoid references to modern political entities (such as «Spain») as they can result in misleading interpretations. From the year 1500 on, though, modern Spain maps might be useful for understanding population dynamics, as the very idea of the unified country was already born. This section compares the early country demographics and its changes between the years 1500 and 1800. In these maps, cities are depicted proportionally to their population size, with the three largest ones having their names written besides them. By the year 1500, briefly after the end of the Reconquista process and the discovery of America, Granada (200,000) was the largest city in Spain by far, followed by Sevilla and Valencia, both of them with a bit more of 60,000 people. Interestingly, the majority of cities which we have data about belong to the Southern part of Spain. Moreover, it is noticeable the almost negligible size of Madrid, especially when compared to other major central cities such as Toledo or Valladolid.
This second map represents the situation a century after the fall of the Emirate of Granada, at the cent of the Habsburg Spanish Empire in the year 1600. Three key changes have taken place during those 100 years. Firstly, the city of Madrid is now among the three largest ones, having absorbed part of its surrounding cities’ population (Valladolid, Burgos or even Toledo). Secondly, Sevilla has overtaken Granada as the largest national city, mainly due to its key role in coordinating overseas trade and importation of Latin American commodities. Thirdly, first signs of a population centralization dynamics appear: Andalusian cities have lost size with no exception, as well as those of the old Crown of Aragón.

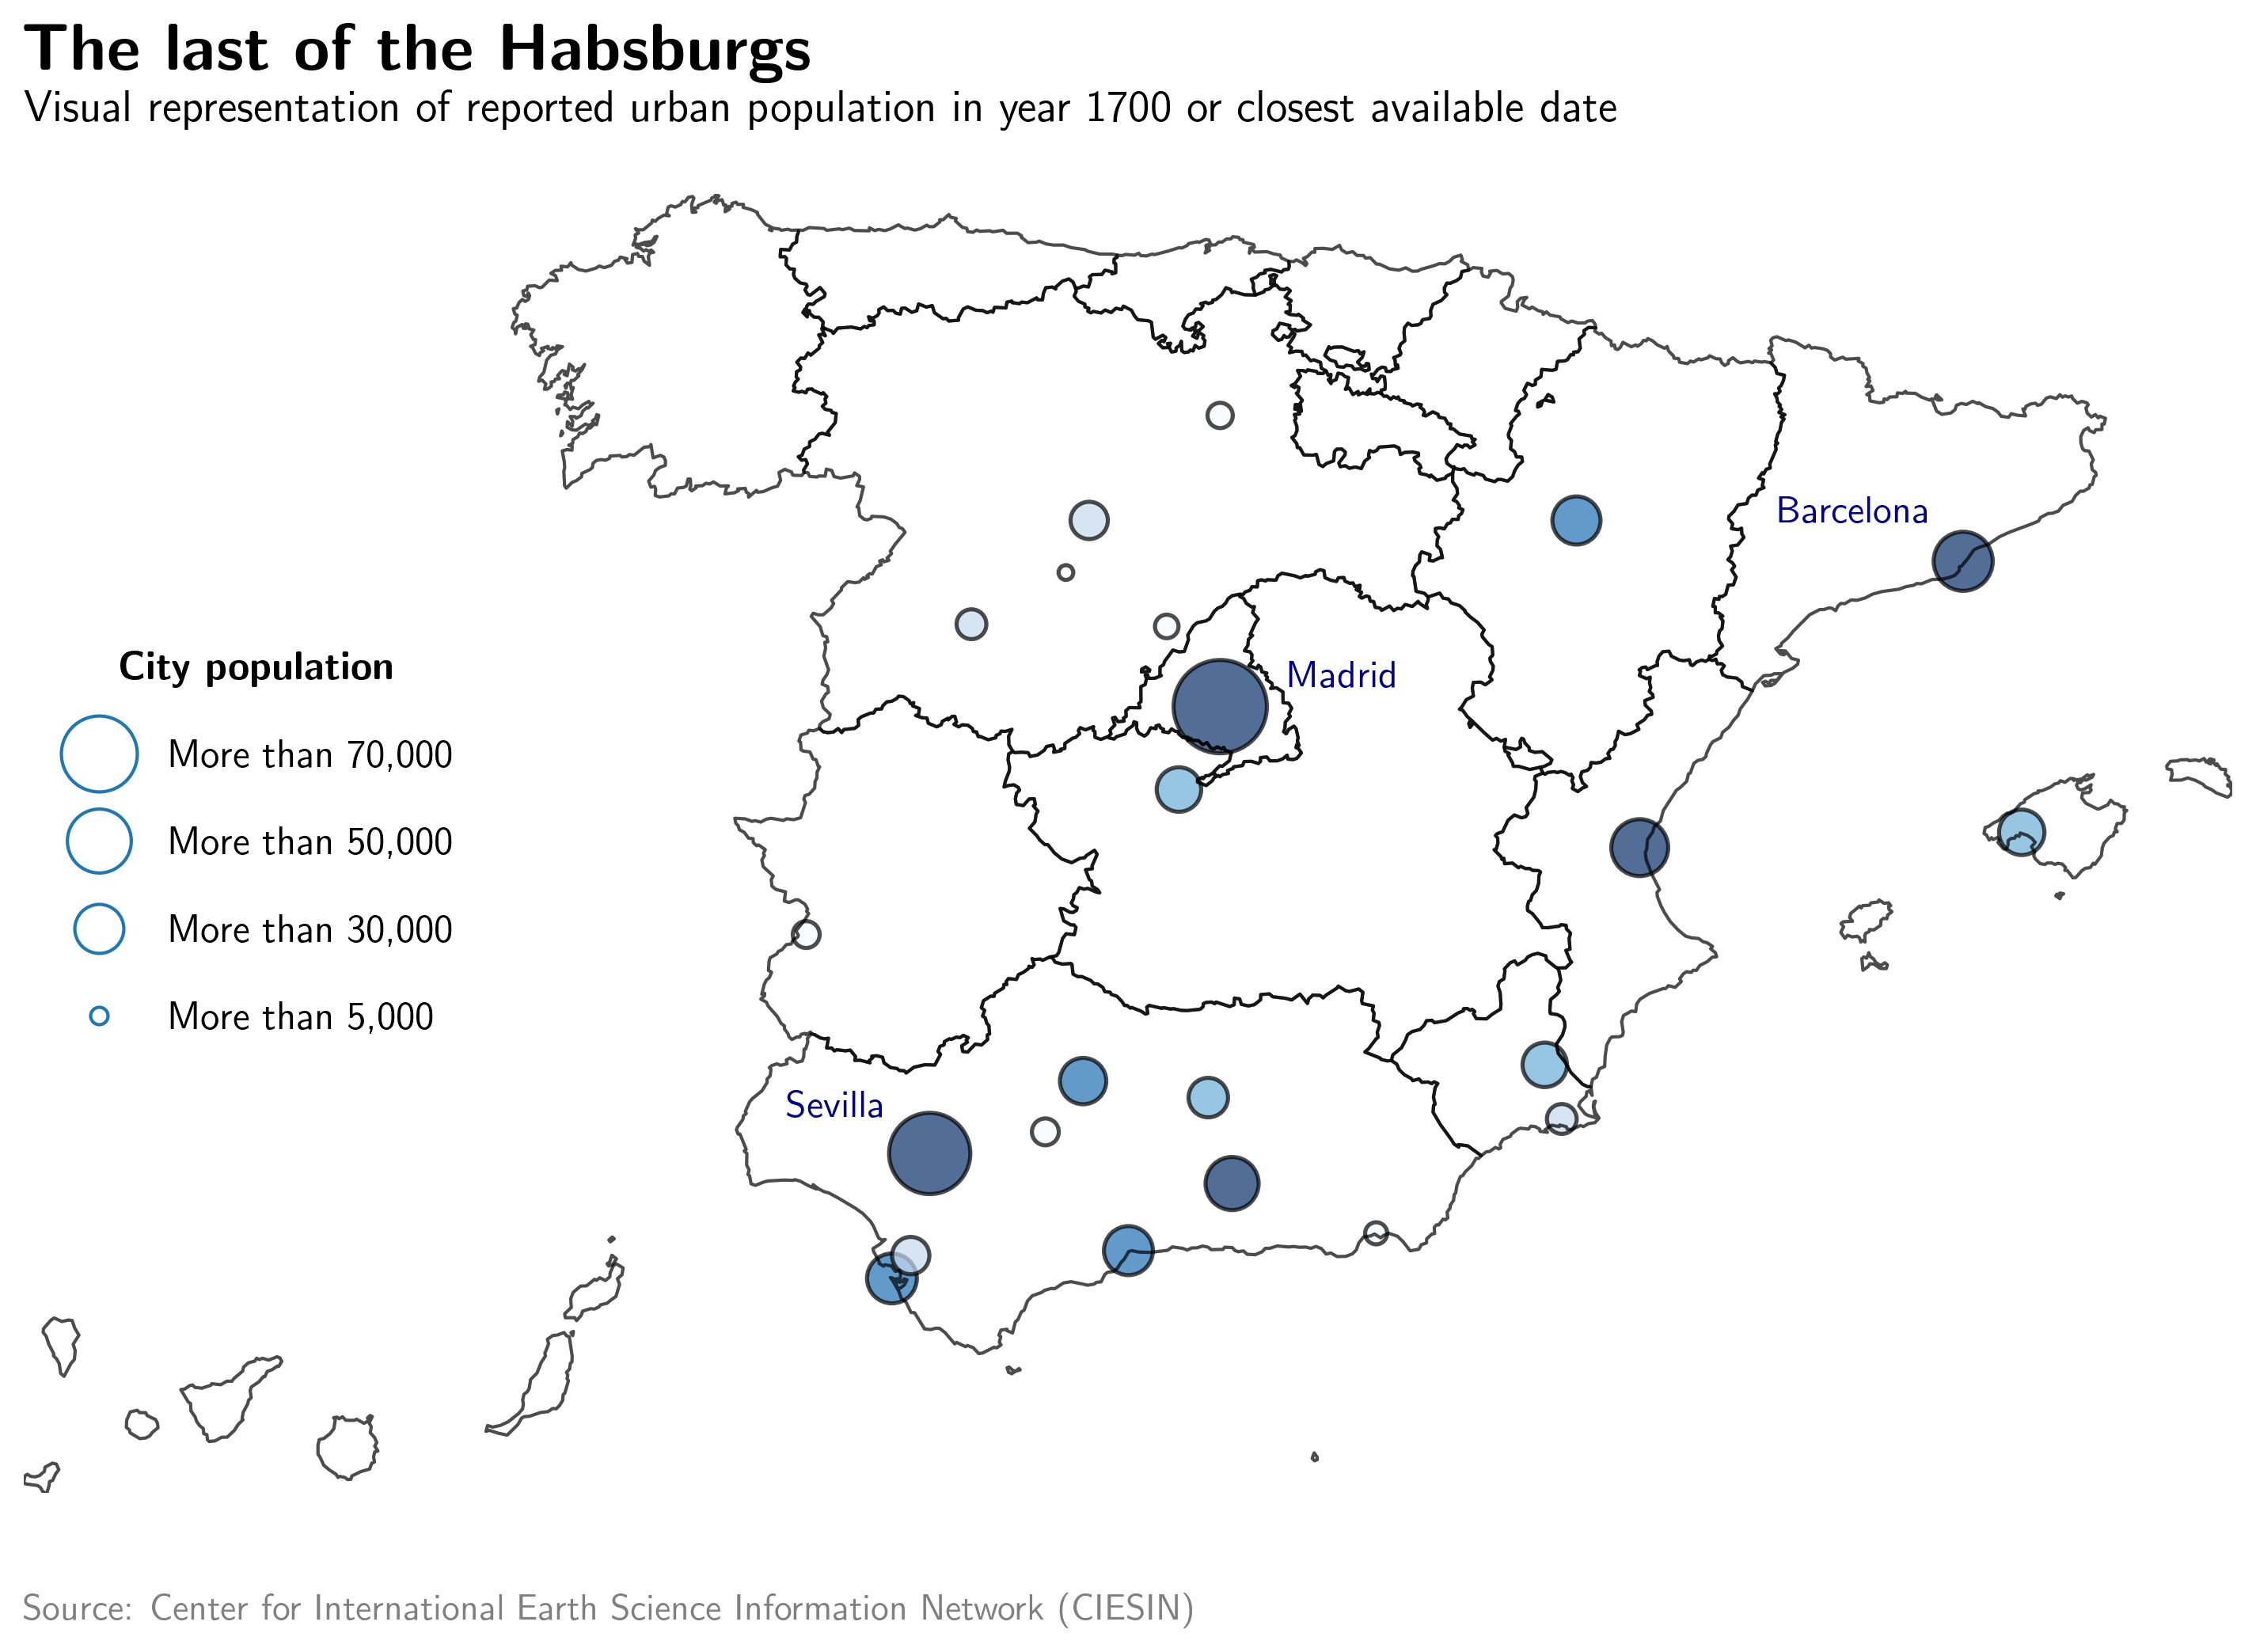
By the year 1700, some relevant changes have taken place. Madrid has definitely achieved the role of largest and leading Spanish city, barely 150 years after King Felipe II established the capital in it. Sevilla, still operating as a key trade port, ranks now second in the list and has lost the 100,000 inhabitants barrier. In the East coastline, Barcelona has slightly beaten Valencia up and closes the Top-3 with 43,000 people living in it. The demographic centralization process observed in the year 1600 map is confirmed when looking at how large cities of Castilla y León or Toledo in La Mancha have more than halved their size. Interestingly, the map shows the emergence of two new major cities on the Southern coast: Málaga and Cádiz, both having around 30,000 inhabitants. It is called The last of the Habsburgs as after the 1714 Spanish Succession War, the Borbon dynasty will take the throne.

The Spanish population from 1850 on
How did the population grow?
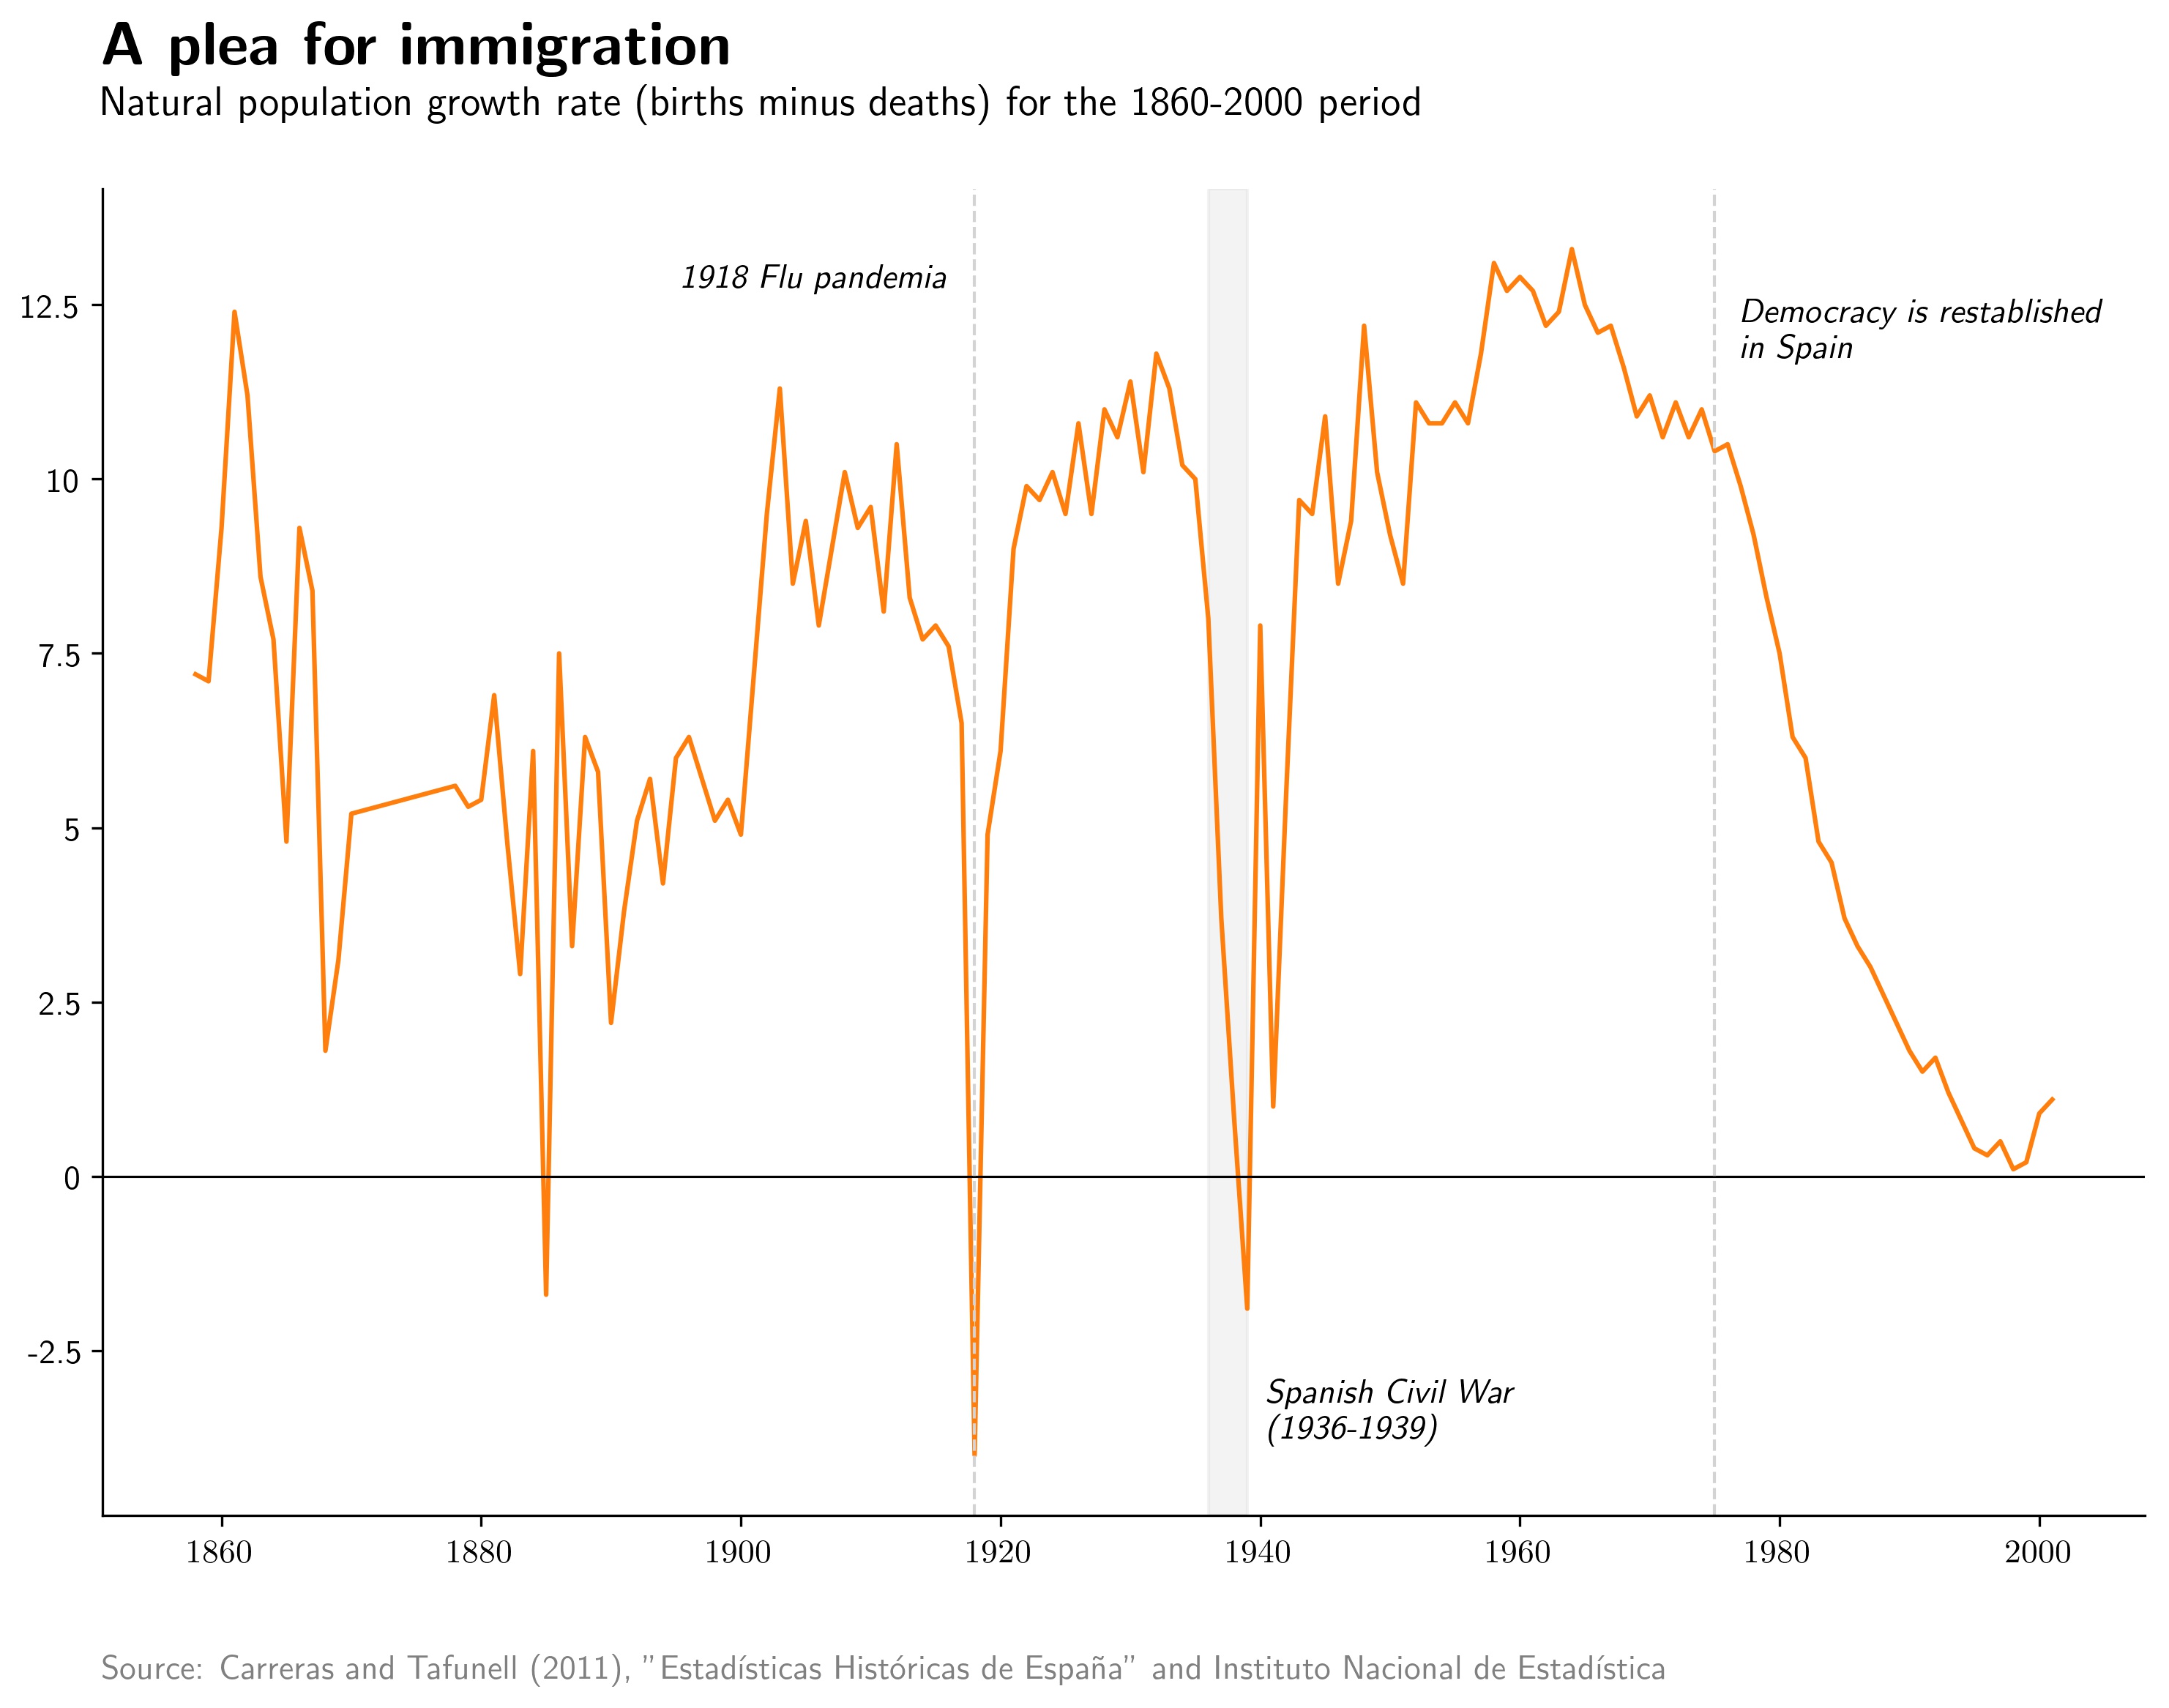
The Spanish population average natural growth rate (the difference between births and deaths, excluding immigration) between the years 1850 and 2000 was 7.3% per annum. Following the Western world demographic expansion in the second half of the 19th Century, Spain experienced large growth rates before the First World War (in which it remained neutral), interrupted by the worldwide Flu pandemia of 1918. Growth boosted again in the Interwar period until the beginning of the Spanish Civil War in 1936, when it turned negative as a result of the conflict. The Francoist dictatorship partially delayed the transition to modern demographics other European countries were experiencing and maintained an extremely high natural growth rate until its end in 1975. In the 20 first years after the restablishment of democracy in Spain, the growth rate was reduced by 20 from 10.4% in 1975 to 0.4% in 1995. However, the progressive arrival of North African and Latin American immigration shyly reverted the trend in the early years of the 21st Century, as their fertility rates are much higher than those of local Spaniards.
The large natural growth rates observed are responsible for the rapid demographic expansion Spain experienced from 1850 on. By the mid-19th Century, the country had 15.5M inhabitants, which turned into 18M in the year 1900. Immediately after the First World War, the Spanish population added up to 21M and, the year before its Civil War started, it had reached 24M. When the Franco regime collapsed, the country had 35.6M inhabitants, and it entered the 21st Century with somewhat 40M people. In 2011, the year of the last official countrywide census, the Spanish population was 46.8M.
Regional contribution to growth
Naturally, not all regions contributed the same way to the demographic expansion of the country. Modern Spanish territorial administration has remained almost unchanged since the year 1850, especially at province levels. Thus, a long-run comparison using current regions can be conducted without critical issues. The following figure breaks down the regional weight in the Spanish population growth for the last 150 years.
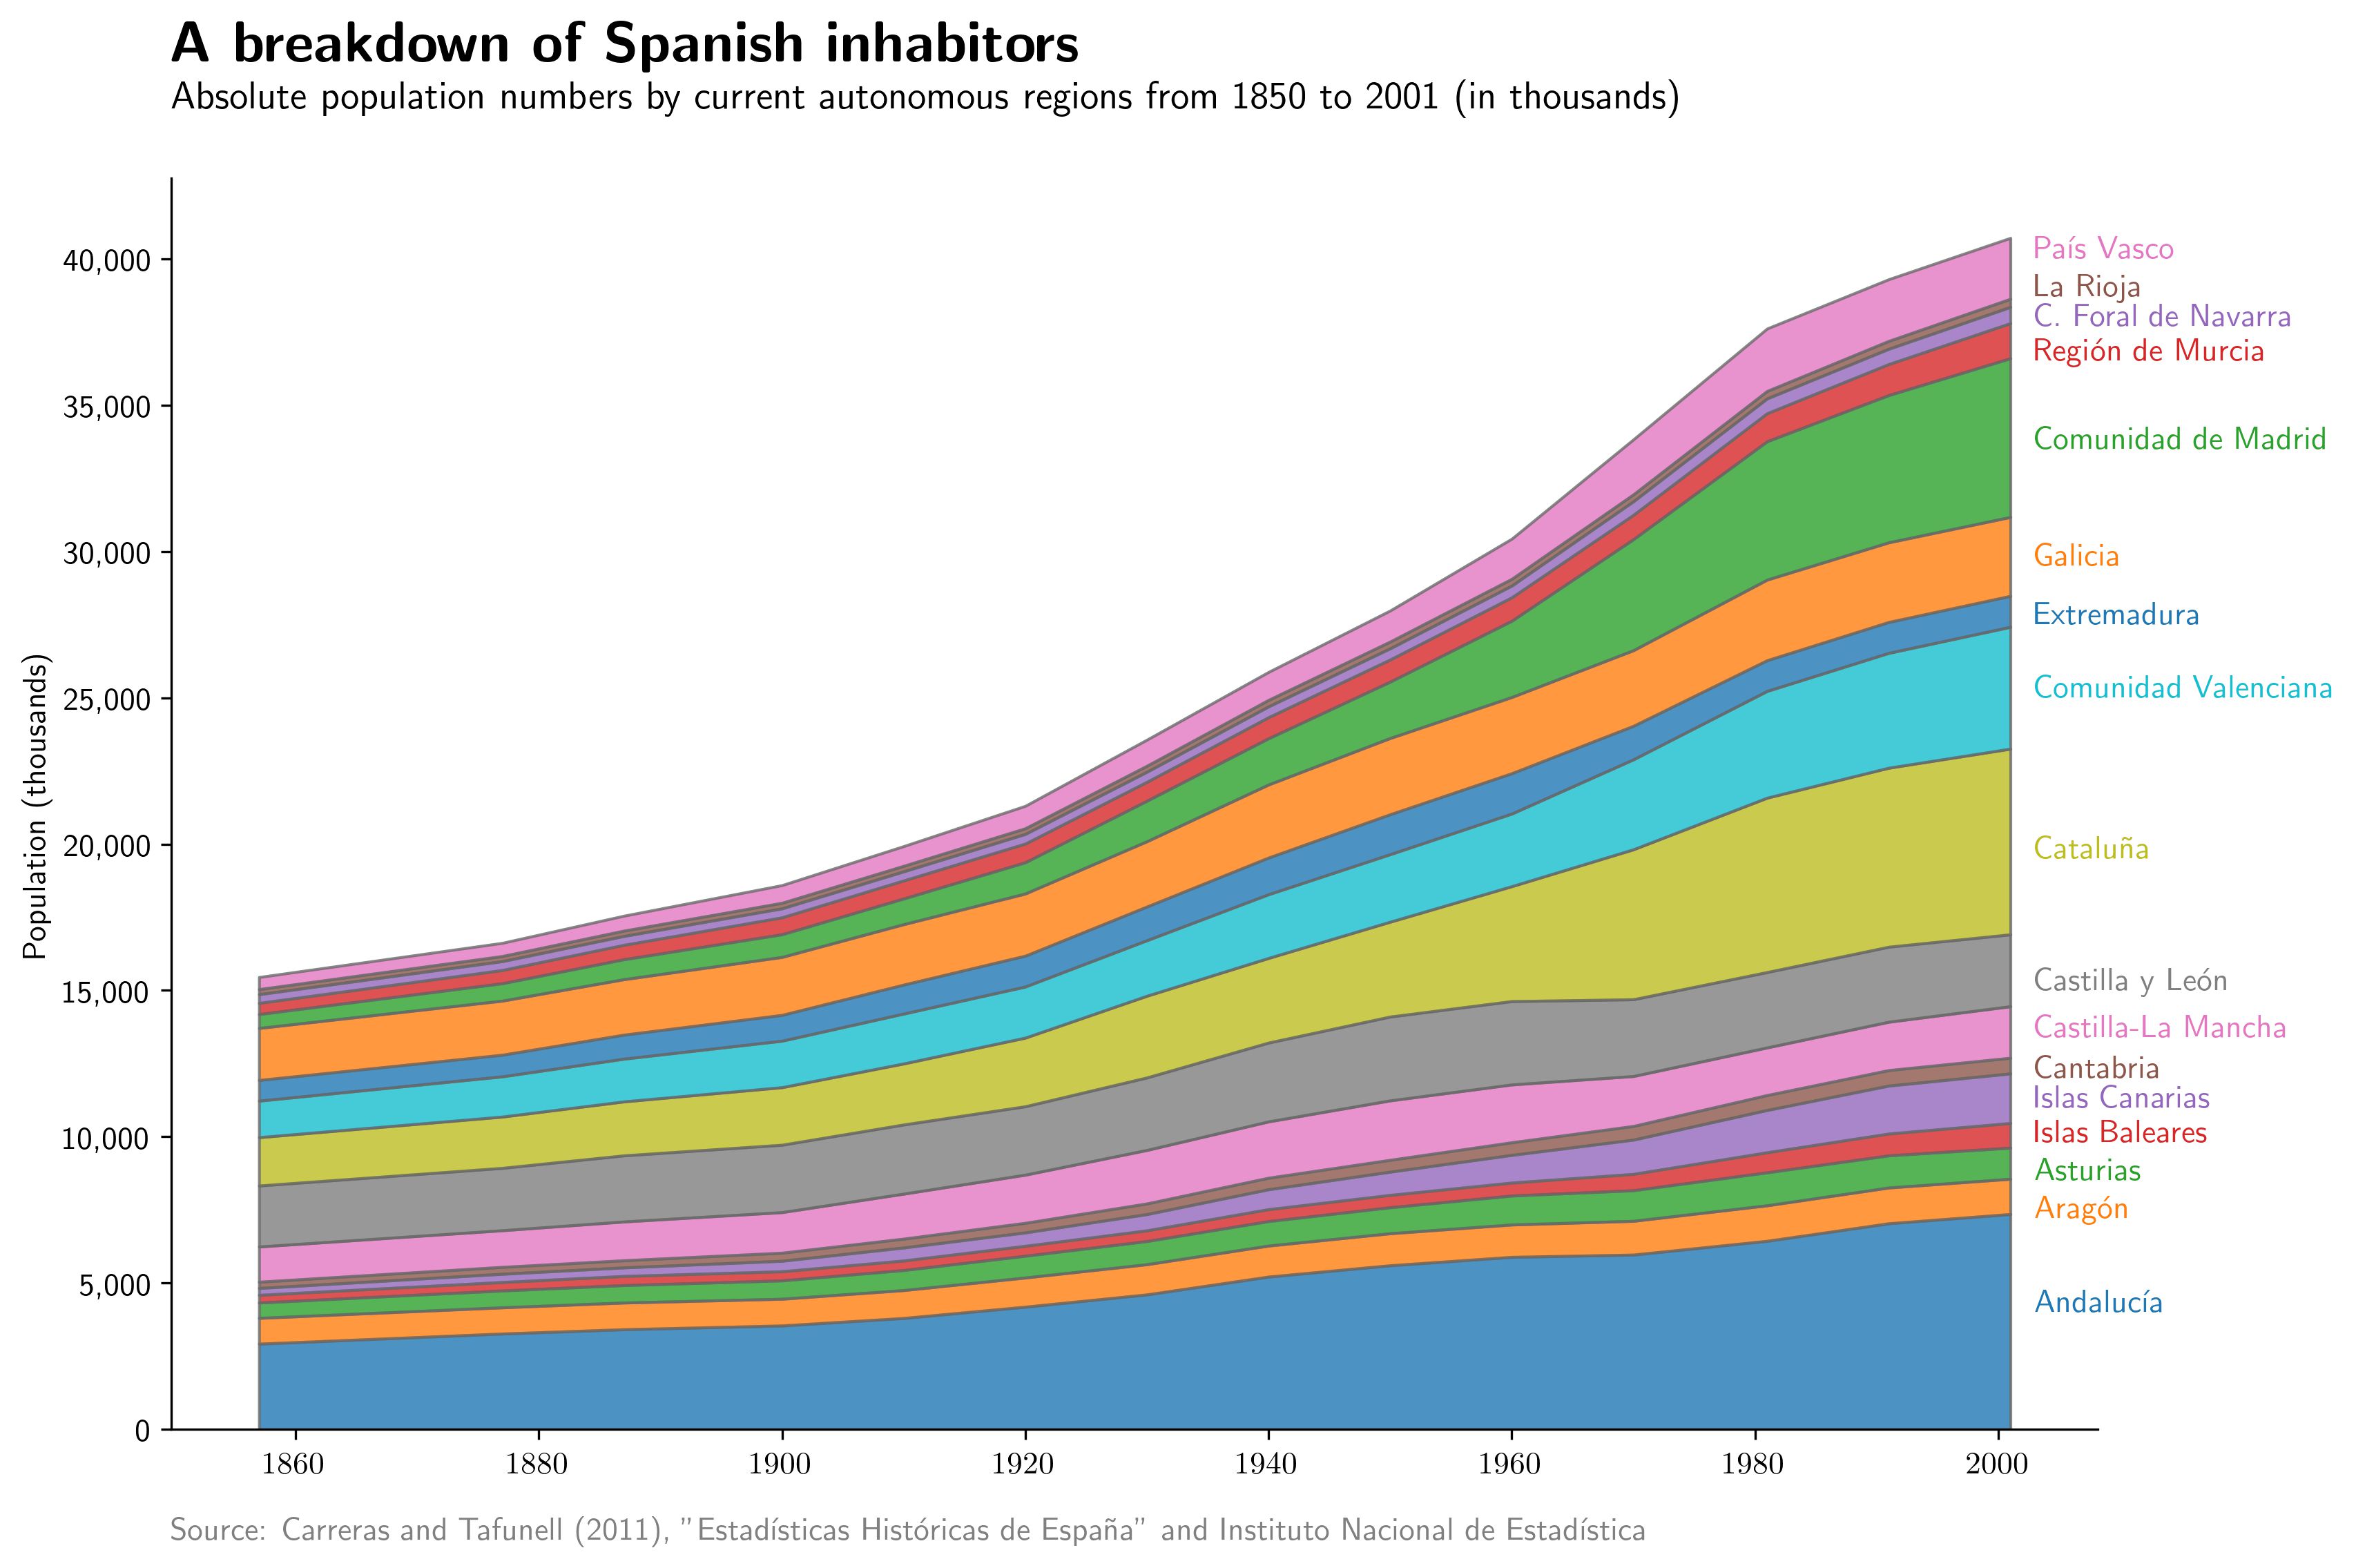
In 1858, the first year for which we have reliable province data, the three largest regions in Spain (in terms of population) were Andalucía (almost 4M inhabitants), Castilla y León (around 2.5M people) and Galicia (slightly over 2M). Cataluña and Comunidad Valenciana, the two large Eastern regions, were similar in size and close to the third position. The nowadays Madrid region was almost negligible, as it uniquely contained the capital city population. Things remained the same almost half a century until the year 1900, when rapid economic development dynamics started affecting the population distribution. By the year the Civil War started (1936), the industrial weight of Barcelona had boosted both population growth and arrivals from other regions. As a consequence, the Catalan region had already overcome Galicia and Castilla y León as most populated areas. The same happened with the Comunidad Valenciana, even if at a lower scale. Regarding the Madrid region, it had doubled its population of the year 1858 and showing a clearly rising path.
This early trends accentuated during the dictatorship. The strong political role of Madrid made it a huge demographic center, going from 2.1M inhabitants in 1940 to 4.7M in 1981 and creating some imbalances with its neighbours (such as Castilla-La Mancha). Cataluña benefited from its economic leading position and received large amounts of internal immigration during the 1960s, allowing it to grow from 2.9M inhabitants in 1940 to 5.9M in 1981. Despite its population outflows, Andalucía kept its first position untouched, entering the democratic period with more than 7M people. The lack of concrete population distribution policies made little change to the dynamics that have been in place for the last 100 years, and Spain reached the year 2000 with massive regional disequilibria. Interestingly, the País Vasco region managed to multiply by five its population in the period due to its heavy industry economic profile and high living quality standards.
The Spanish demographic transition
Demographic transitions are long-run sequences by which countries go from high to low mortality and birth rates. They are typically divided in four stages: a first one in which both rates are quite high, a second one in which mortality falls but natality does not, a third one in which mortality keeps low and birth rates decay and a fourth one with both low birth and death rates. Nowadays, there is some evidence on a fifth potential stage involving a little natality rise, but cannot be worldwide extrapolated yet. Demographic transitions are the key reason why population growth does not explode in the very long run despite showing some exponential behavior in some periods.
Spanish data on mortality and birth rates goes back only to 1858, hence allowing only to observe the three last stages of the transition: high natality with decreasing mortality, low mortality with decreasing natality and low mortality and slightly increasing natality. The third stage covers most of the analyzed period, between the years 1858 and 1980, approximately. Interestingly, mortality rates in Spain were pretty high at the beginning of the 20th Century, especially when compared to other European countries (29 out of 1,000 people for Spain, vis-à-vis 23.8 in Italy, 22.1 in Germany or 21.9 in France). During the next thirty years, the rate halved with the solely interruption of the 1918 Flu, catching up those of its neighbours, and kept diminishing until 1981, when it reached its contemporaneous values. Although the birth rate also decreased during the period, it remained high and created a postive gap responsible for rapid population growth. After the year 1975, the gap between birth and death rates starts to close, causing the population growth to diminish and eventually disappearing around the year 2000 (fourth stage). After the arrival of the 21st Century, there is a shy recovery of birth rates (mainly caused by immigrant groups) which points out to the fifth stage of the transition. As it can be seen, the total Spanish population goes from around 15M in 1850 to 40M in 2000, but most of that growth takes place between 1850 and 1981 (when the population adds up to 38M) or third stage, hence confirming the demographic transition scheme.
Migration dynamics
Overseas migration
Apart from the natural growth rate, which is responsible for most of the rapid increase of the Spanish population in the last two centuries, migrations do also played their role. Until the very late 19th Century, Spain kept some overseas territories (Cuba, Puerto Rico and the Philippines) and it lost many others in the previous decades. Thus, population inflows and outflows were common and that time, and kept going on even after those colonies acquired independence.
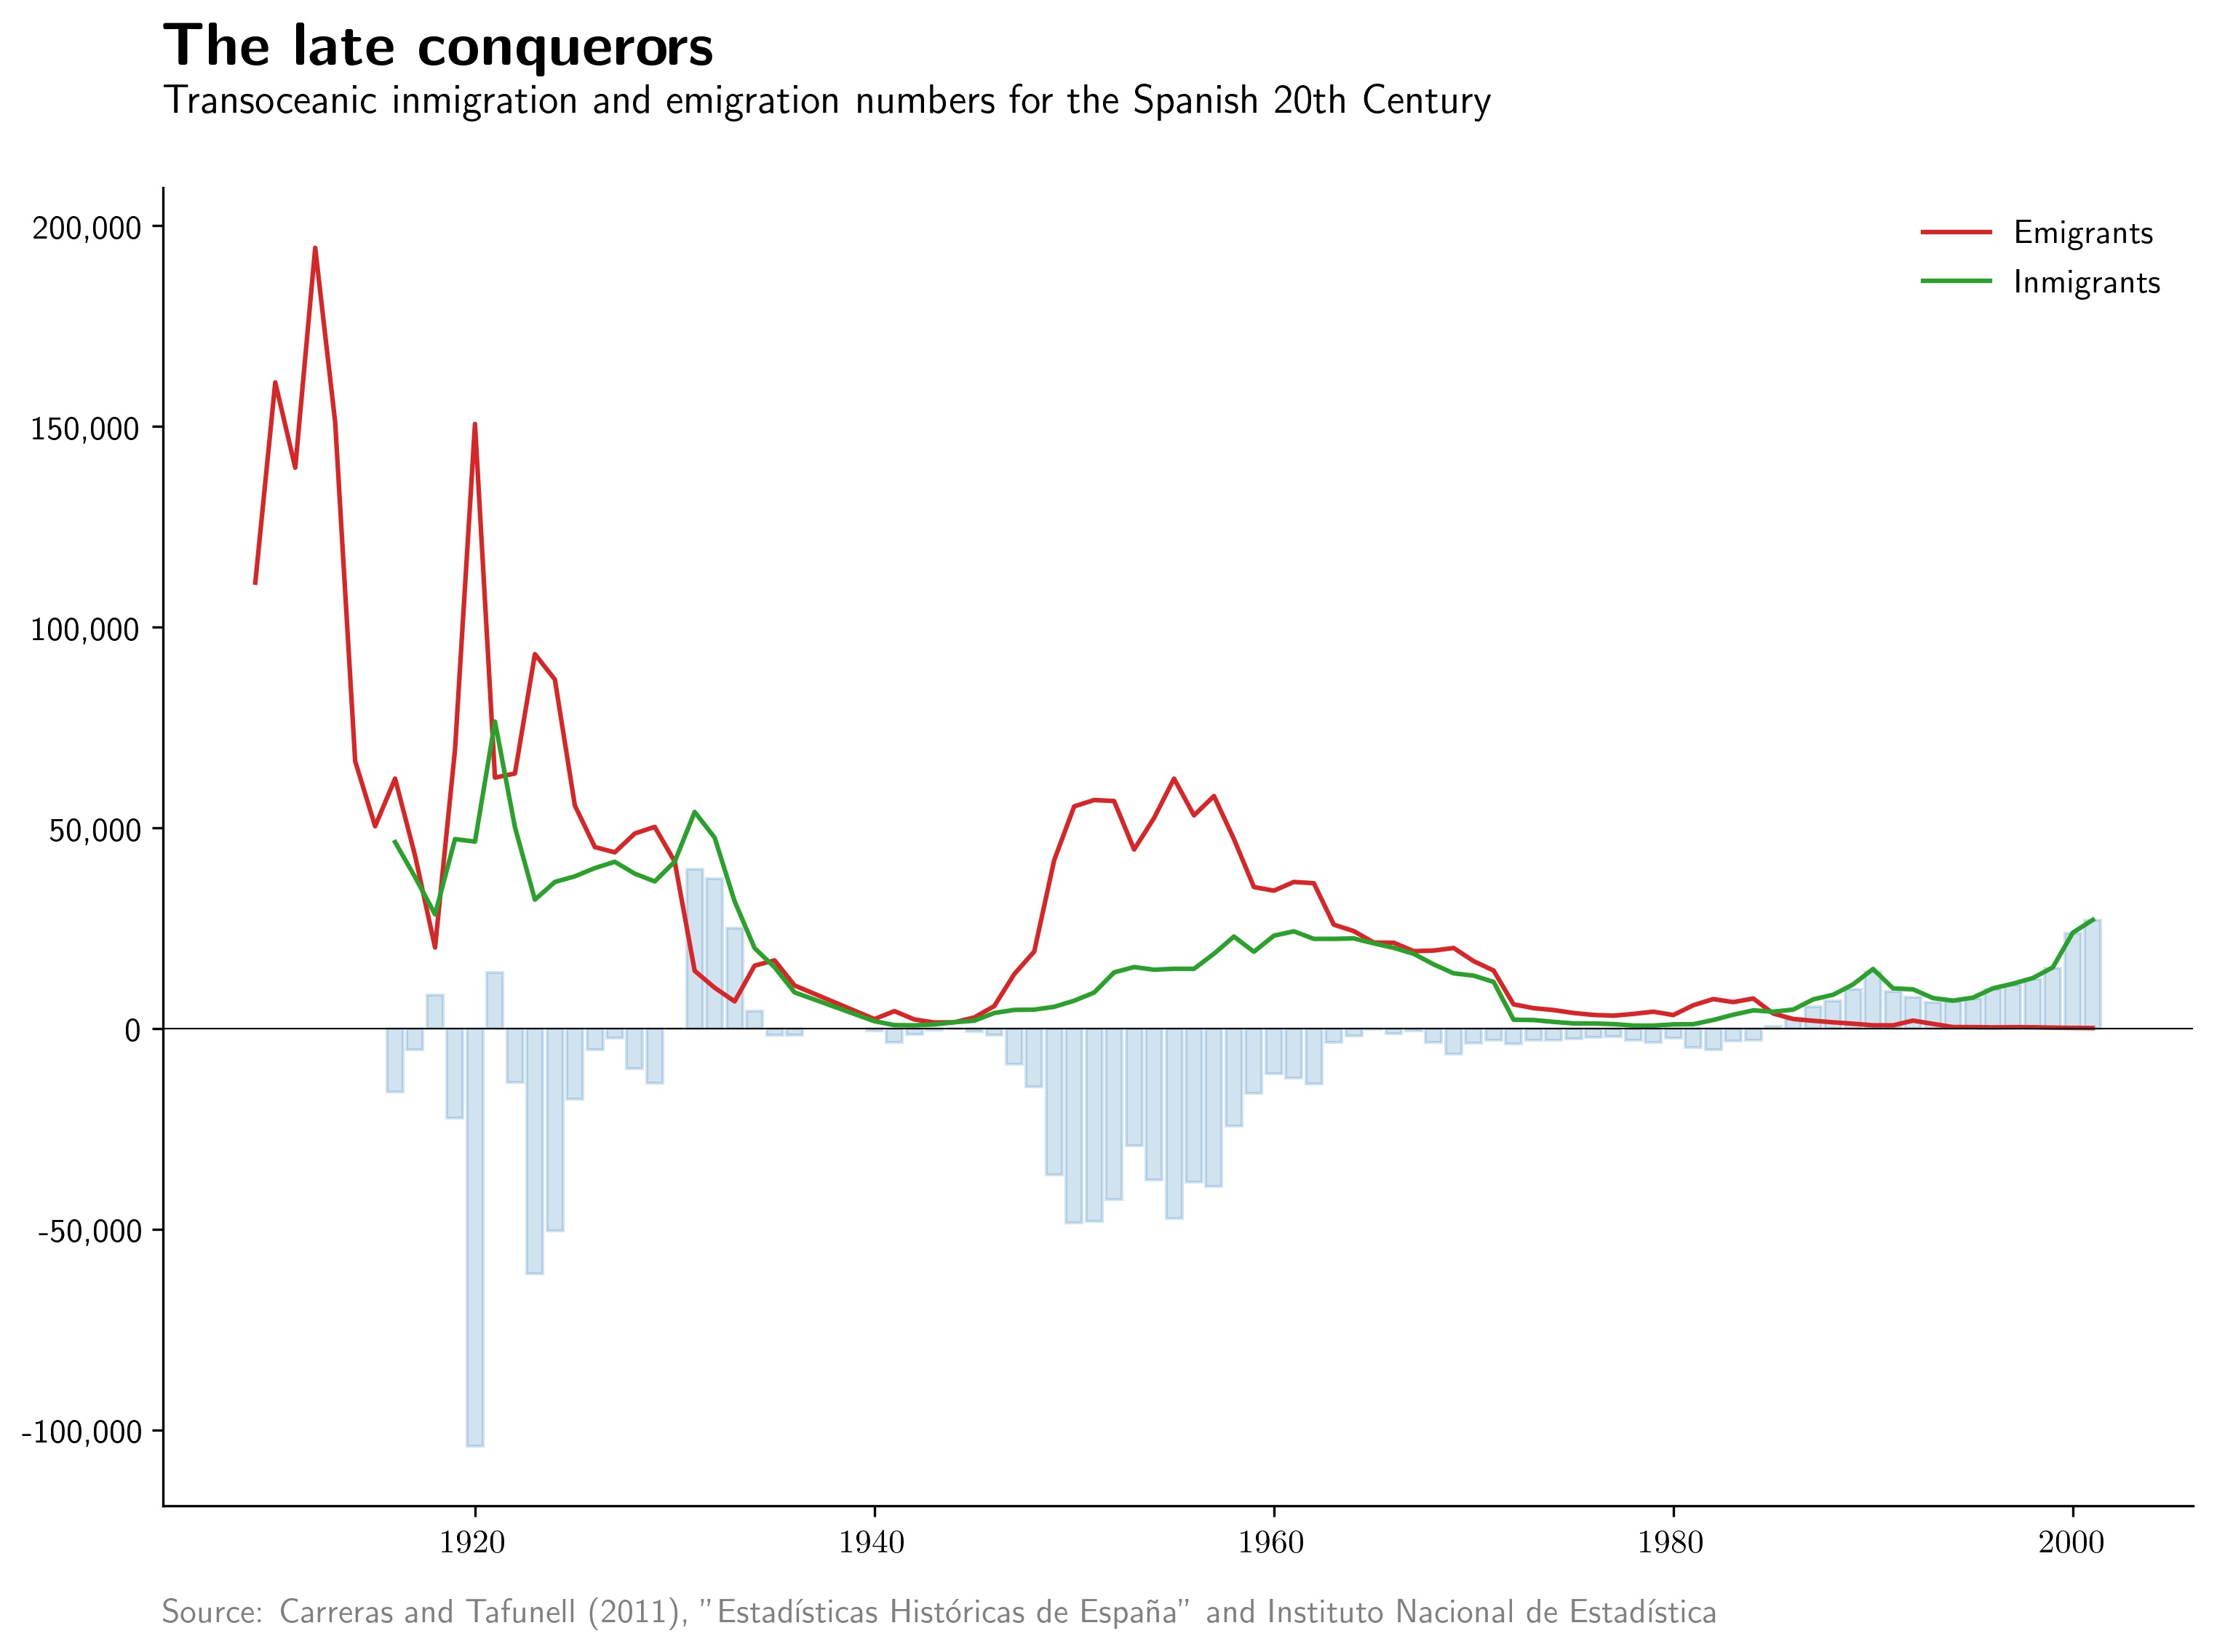
Reliable statistics on transoceanic migration go back to the year 1900. During the first two decades of recorded movements, emigration was particularly high, with an average of 100,000 departures a year. There is no way to derive the aggregate balance, as data for immigrants is not available, but it is likely to have been rather negative. In the Interwar period (1920 and 1930 decades), population outflows decrease to the level of inflows, stabilizing the balance and even turning it positive in the years before the Spanish Civil War. The conflict and the immediate postwar period (which was particularly tough in Spain due to the lack of a Marshall Plan) reduced transoceanic movements to zero until the late 40s, when emigration boomed again. Between 1950 and 1960, Spain suffered from a chronicle annual loss of somewhat 50,000 inhabitants, which ended up compensating around the year 1965, coinciding with the opening of the Francoist dictatorship. After its fall in 1975, transoceanic numbers went back to zero and acquired a diverging path in the mid-80s; emigrants remained marginal (especially when compared to 1900 numbers) but immigrants started to grow and reverted the historically negative migration balance mainly due to arrivals from Latin American and North African countries.
European migration
Internal migration
The Spanish 20th Century is famous for its massive intra-country population movements, both because the very size of those displacements and their unidirectional path (some regions being clearly migrant-issuers and others being migrant-receivers). The following figure plots internal population inflows and outflows for the 1900-2000 period in the 8 regions with largest migration numbers. Even if those selected regions do not account for the total internal movements, they reflect the largest trends and ease the interpretation of historical data. However, the complete numbers are also available.

In the early years of the 20th Century, internal migration did not represent a large source of movements yet. Although people were already leaving certain regions (Extremadura or Andalucía), most of them were still heading to America. That pattern started changing in 1910 and became marginal in the interwar period. Madrid and Cataluña regions were the most favored territories receiving up to 800K people in those two decades. The 1930s decade interrupted the growth path internal population movements had been following since the beginning of the century, and the Civil War sequels extended until the 1940s. Migration boomed after the worst years of the postwar period. In the decade of 1950, almost 1.5M people changed region, being Andalucía (600K) and Castilla y León (350K) the two most affected areas. The rapid industrial growth of Barcelona and the administrative development of Madrid attracted people from those regions, which did not experience such a rapid recovery from the Civil War casualties, hence speeding up their growth paths. Numbers kept unchanged during the 60s, where other 1.2M Spaniards left their hometowns, most of them (around 800K) arriving to Cataluña and setteling in the Barcelona metro area. Madrid, which had been the first migration receiver since the 1930s, reduced the size of its population inflows as other industrial (País Vasco) and tourism (Comunidad Valenciana) regions gained relevance in the last years of the Francoist regime. By the time democracy was restablished (1975), internal migrations had dropped drastically; around 500K people changed home in the last five years of the dictatorship, but less than 100K did in the first five years of democracy, and numbers never got back to those of the 1960s.
An alternative way of visualizing internal migration patterns is to look at population changes at a municipality scale. By using data on census from the year 1900 on, it is possible to plot demographic growth rates of the Spanish towns and cities in a map for given periods of time. This section initially compares changes between the years 1900 and 2001, and then focuses on shorter time intervals for better conclusions.
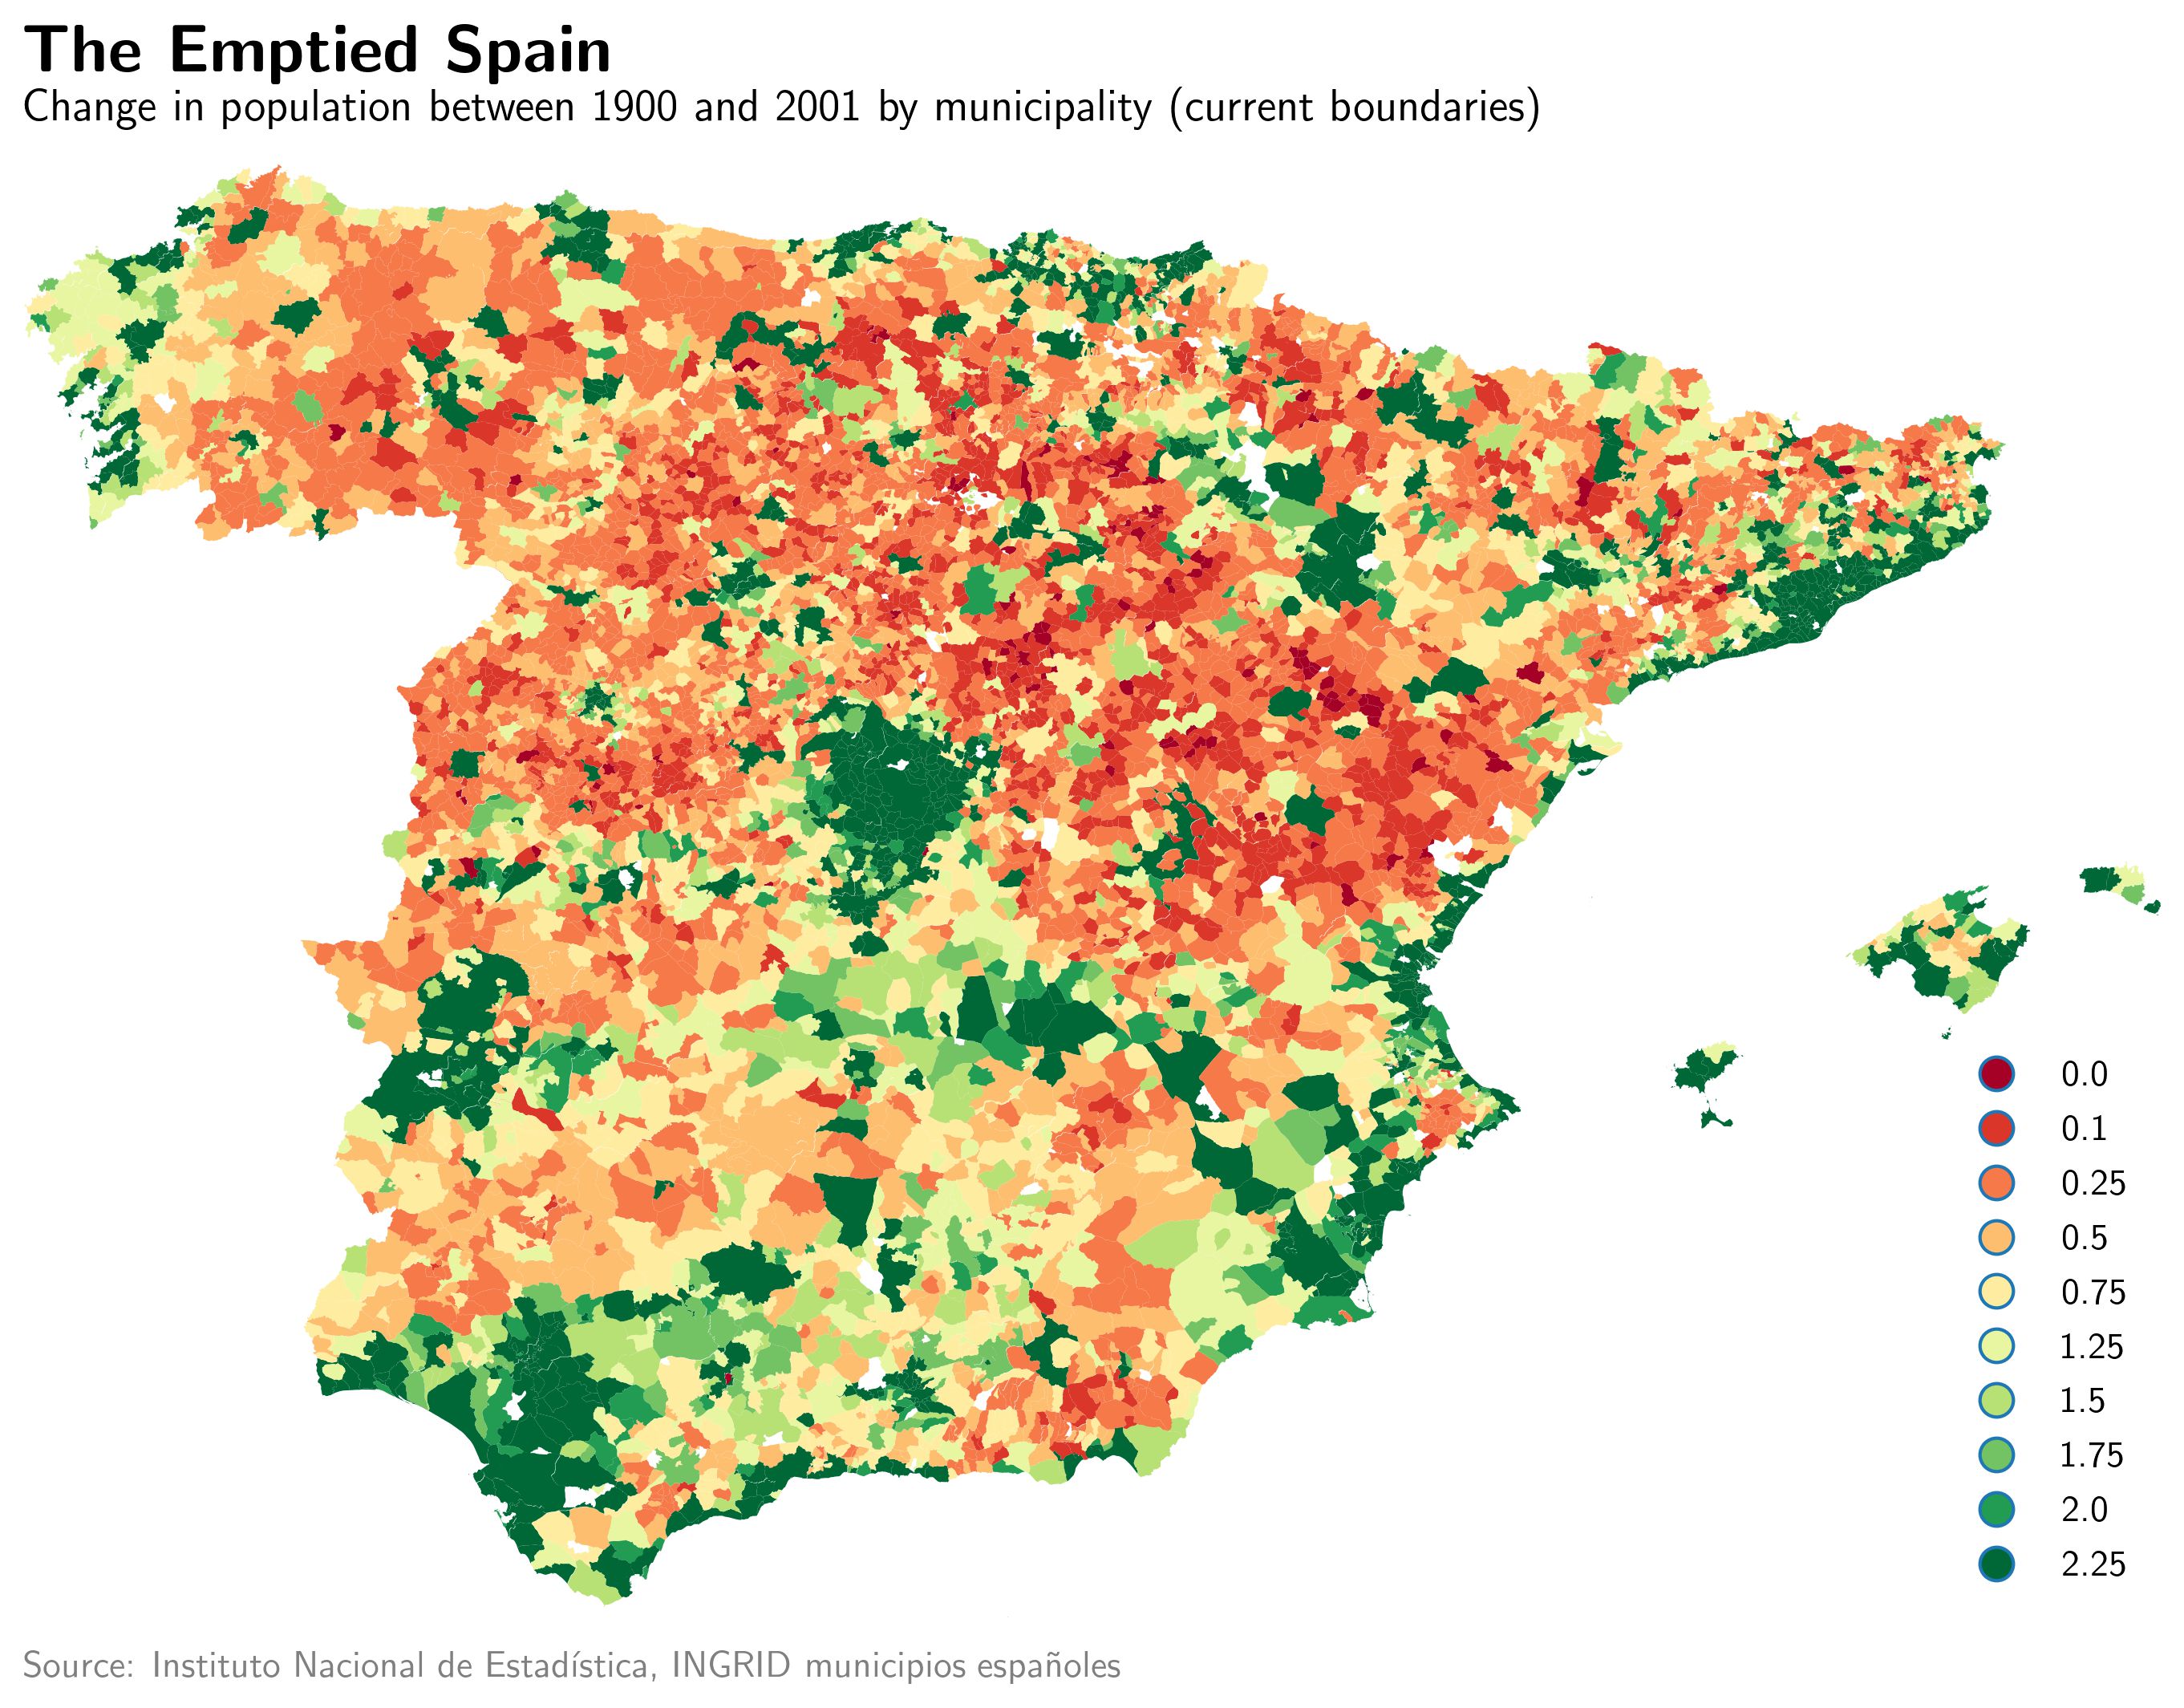
This map plots the demographic evolution at a municipality scale in the last century, comparing the relative size of the population in the year 2001 with respect to 1900. Increases are depicted in a green palette, and losses in a red-orange one. White regions correspond to municipalities for which there is no information available. The map is orange-predominant, although it has several strong green concentrated zones. Four areas seem to have achieved exponential population growth in the century: the Barcelona coastline (including the city itself and its metro area), the Valencia-Alicante region (especially along the coast, but also in some interior locations), the Comunidad de Madrid (involving the city of Madrid and its relatively recent periphery) and, maybe unexpectedly, the Western coast of Andalucía (Cádiz, Sevilla and Huelva regions). Other key growth nodes (in percent terms) are the Cáceres-Badajoz metro areas, the province of Zaragoza and the País Vasco sealine. Far from those, but also accounting for a sustained growth in the period, we find the urban populations from the capital cities in the Cantabric and Atlantic coasts (Santiago, Coruña, Santander or Gijón-Oviedo). On the contrary, population losses are not easy to isolate in specific regions. The North-East part of Castilla y León, the South of Aragón, the East of Castilla-La Mancha and the interior region of Comunidad Valenciana stand as the most damaged zones in demographic terms. They are followed by East Andalucía (Almería, Granada and Jaén provinces) and North-West Castilla y León, especially along the Portuguese frontier. Other areas, such as the rural core of Atlantic communities (Galicia or Asturias) or Extremadura have also experienced considerable population degrowth, even if of a smaller magnitude. On a whole, the figure presents the concept of the «Emptied Spain», meaning a vast extension of the national territory has been continuously losing population for the last 100 years, benefiting only large capital cities.
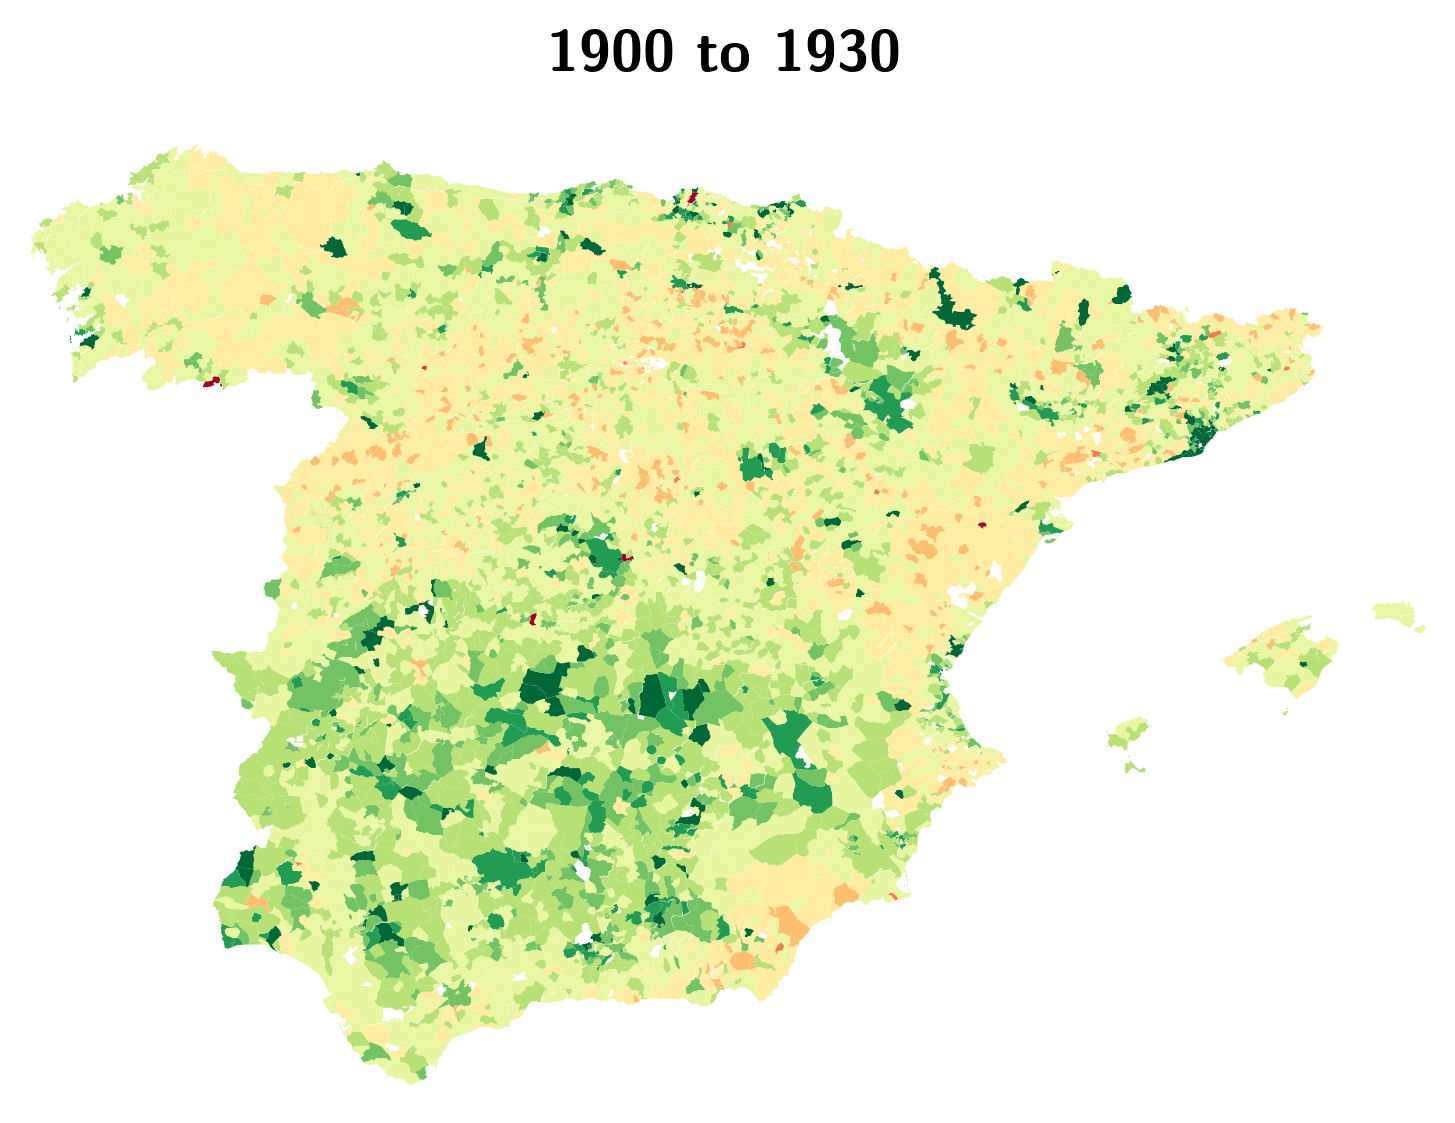


The first map corresponds to the years of Spain’s rapid economic development, partially closing the gap with its European neighbors. Industrial areas such as Cataluña or País Vasco are strongly green-shaded, representing a large population increase. Madrid, along with some South Castilla provinces does also reflect a significant demographic expansion, much like Zaragoza and Sevilla regions. The rural core of the country (mainly, but not only Castilla y León) experiences its first losses, even if moderate, and people living in Northern communities (Galicia, Cantabria, Asturias) seem to start moving from interior villages to the coast. The second map is just the other way around. It plots demographic developments taking place during the Civil War and the early years of the Francoist regime. The strong green barely disappears and the country becomes orange-shaded. Except for the large capital cities, the general trend points out to moderate population decrease in rural areas and tighter degrowth in the East, where the armed conflict and posterior executions ended up being more cruent. Essentially, the figure shows the combined effect of the military campaigns and the early displacements politics of the Francoist regime.
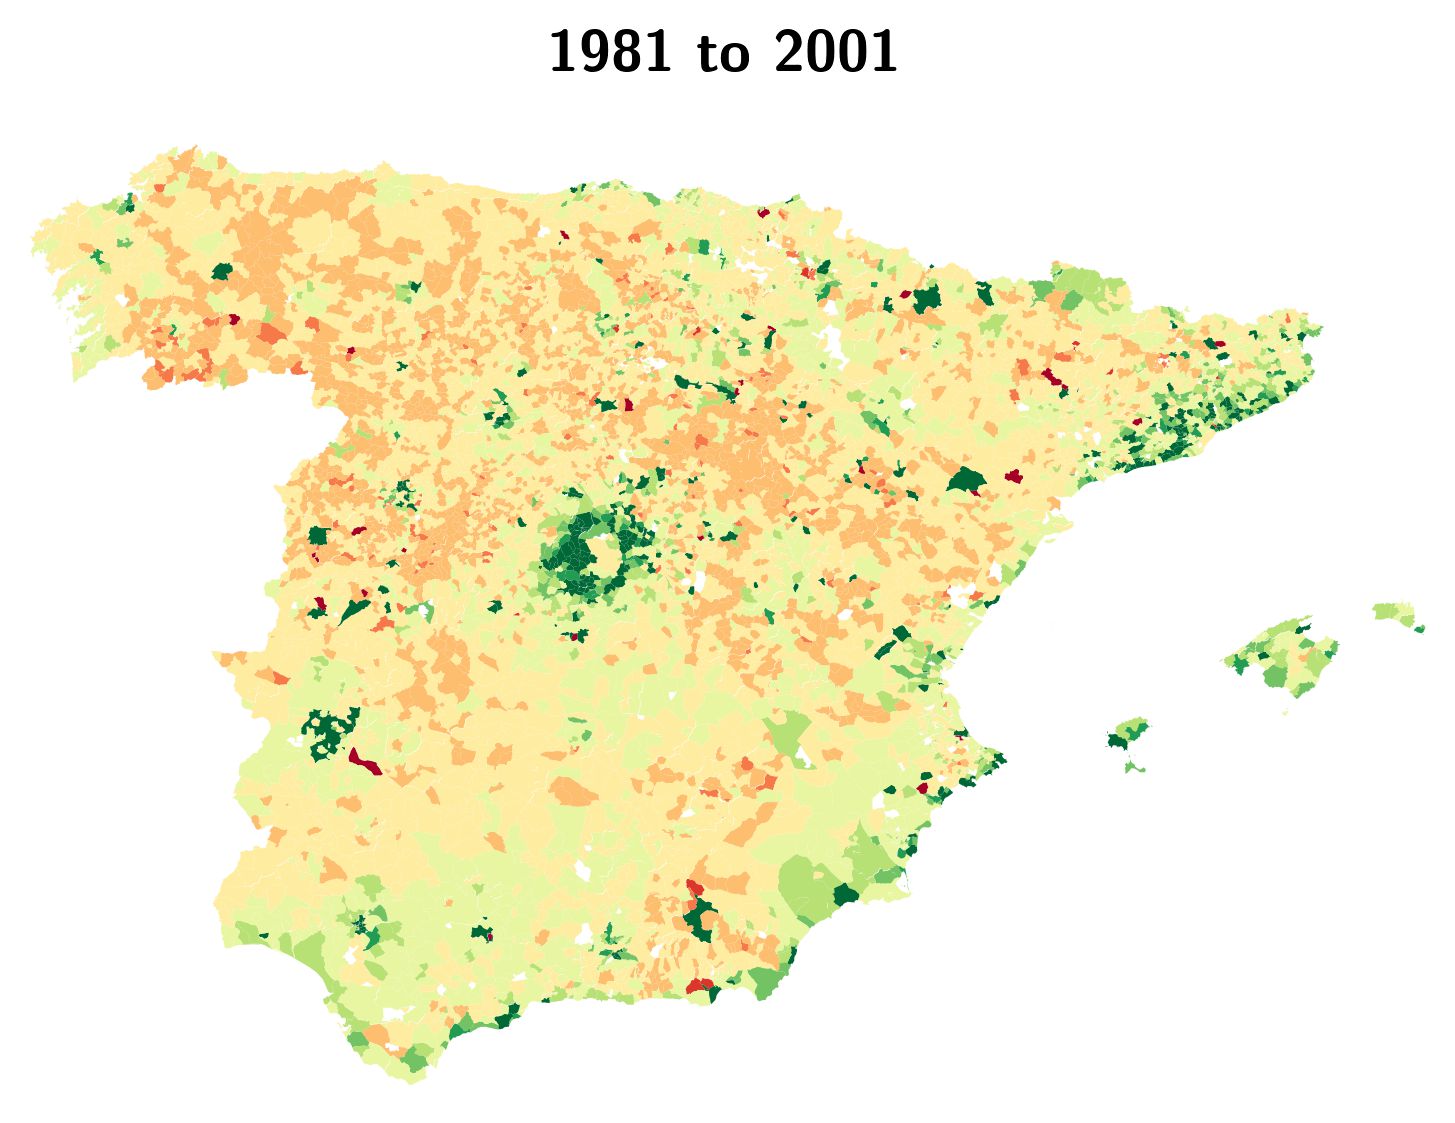
The third map covers the Desarrollismo period, in which the Francoist regime opened to the world and the Spanish economy recovered some Western standards, as well as the first years of democracy. These are the decades of huge internal migrations, when people living either in the countryside or minor cities moved to industrial areas or the capital city of Madrid seeking better conditions. The colors rapidly summarize the process: East Andalucía, Extremadura, Castilla-La Mancha and Castilla León lost many hundred thousand inhabitants in favor of the Barcelona metro area, the Valencia region and Madrid’s periphery. With the solely exception of the Spanish capital, movements strongly followed the from interior to coast trend, as even regions receiving immigrants lost population in their rural areas. The last map plots the modern democracy period until the arrival of the 21st Century. Interestingly, no policies were ever conducted to revert the disequilibria caused by the Francoist regime. Despite their lower intensity, colors ressemble those on the previous figure, meaning large demographic concentration around great metro areas and progressive de-population in rural areas, leading to the scenario of massive imbalances we are living today.
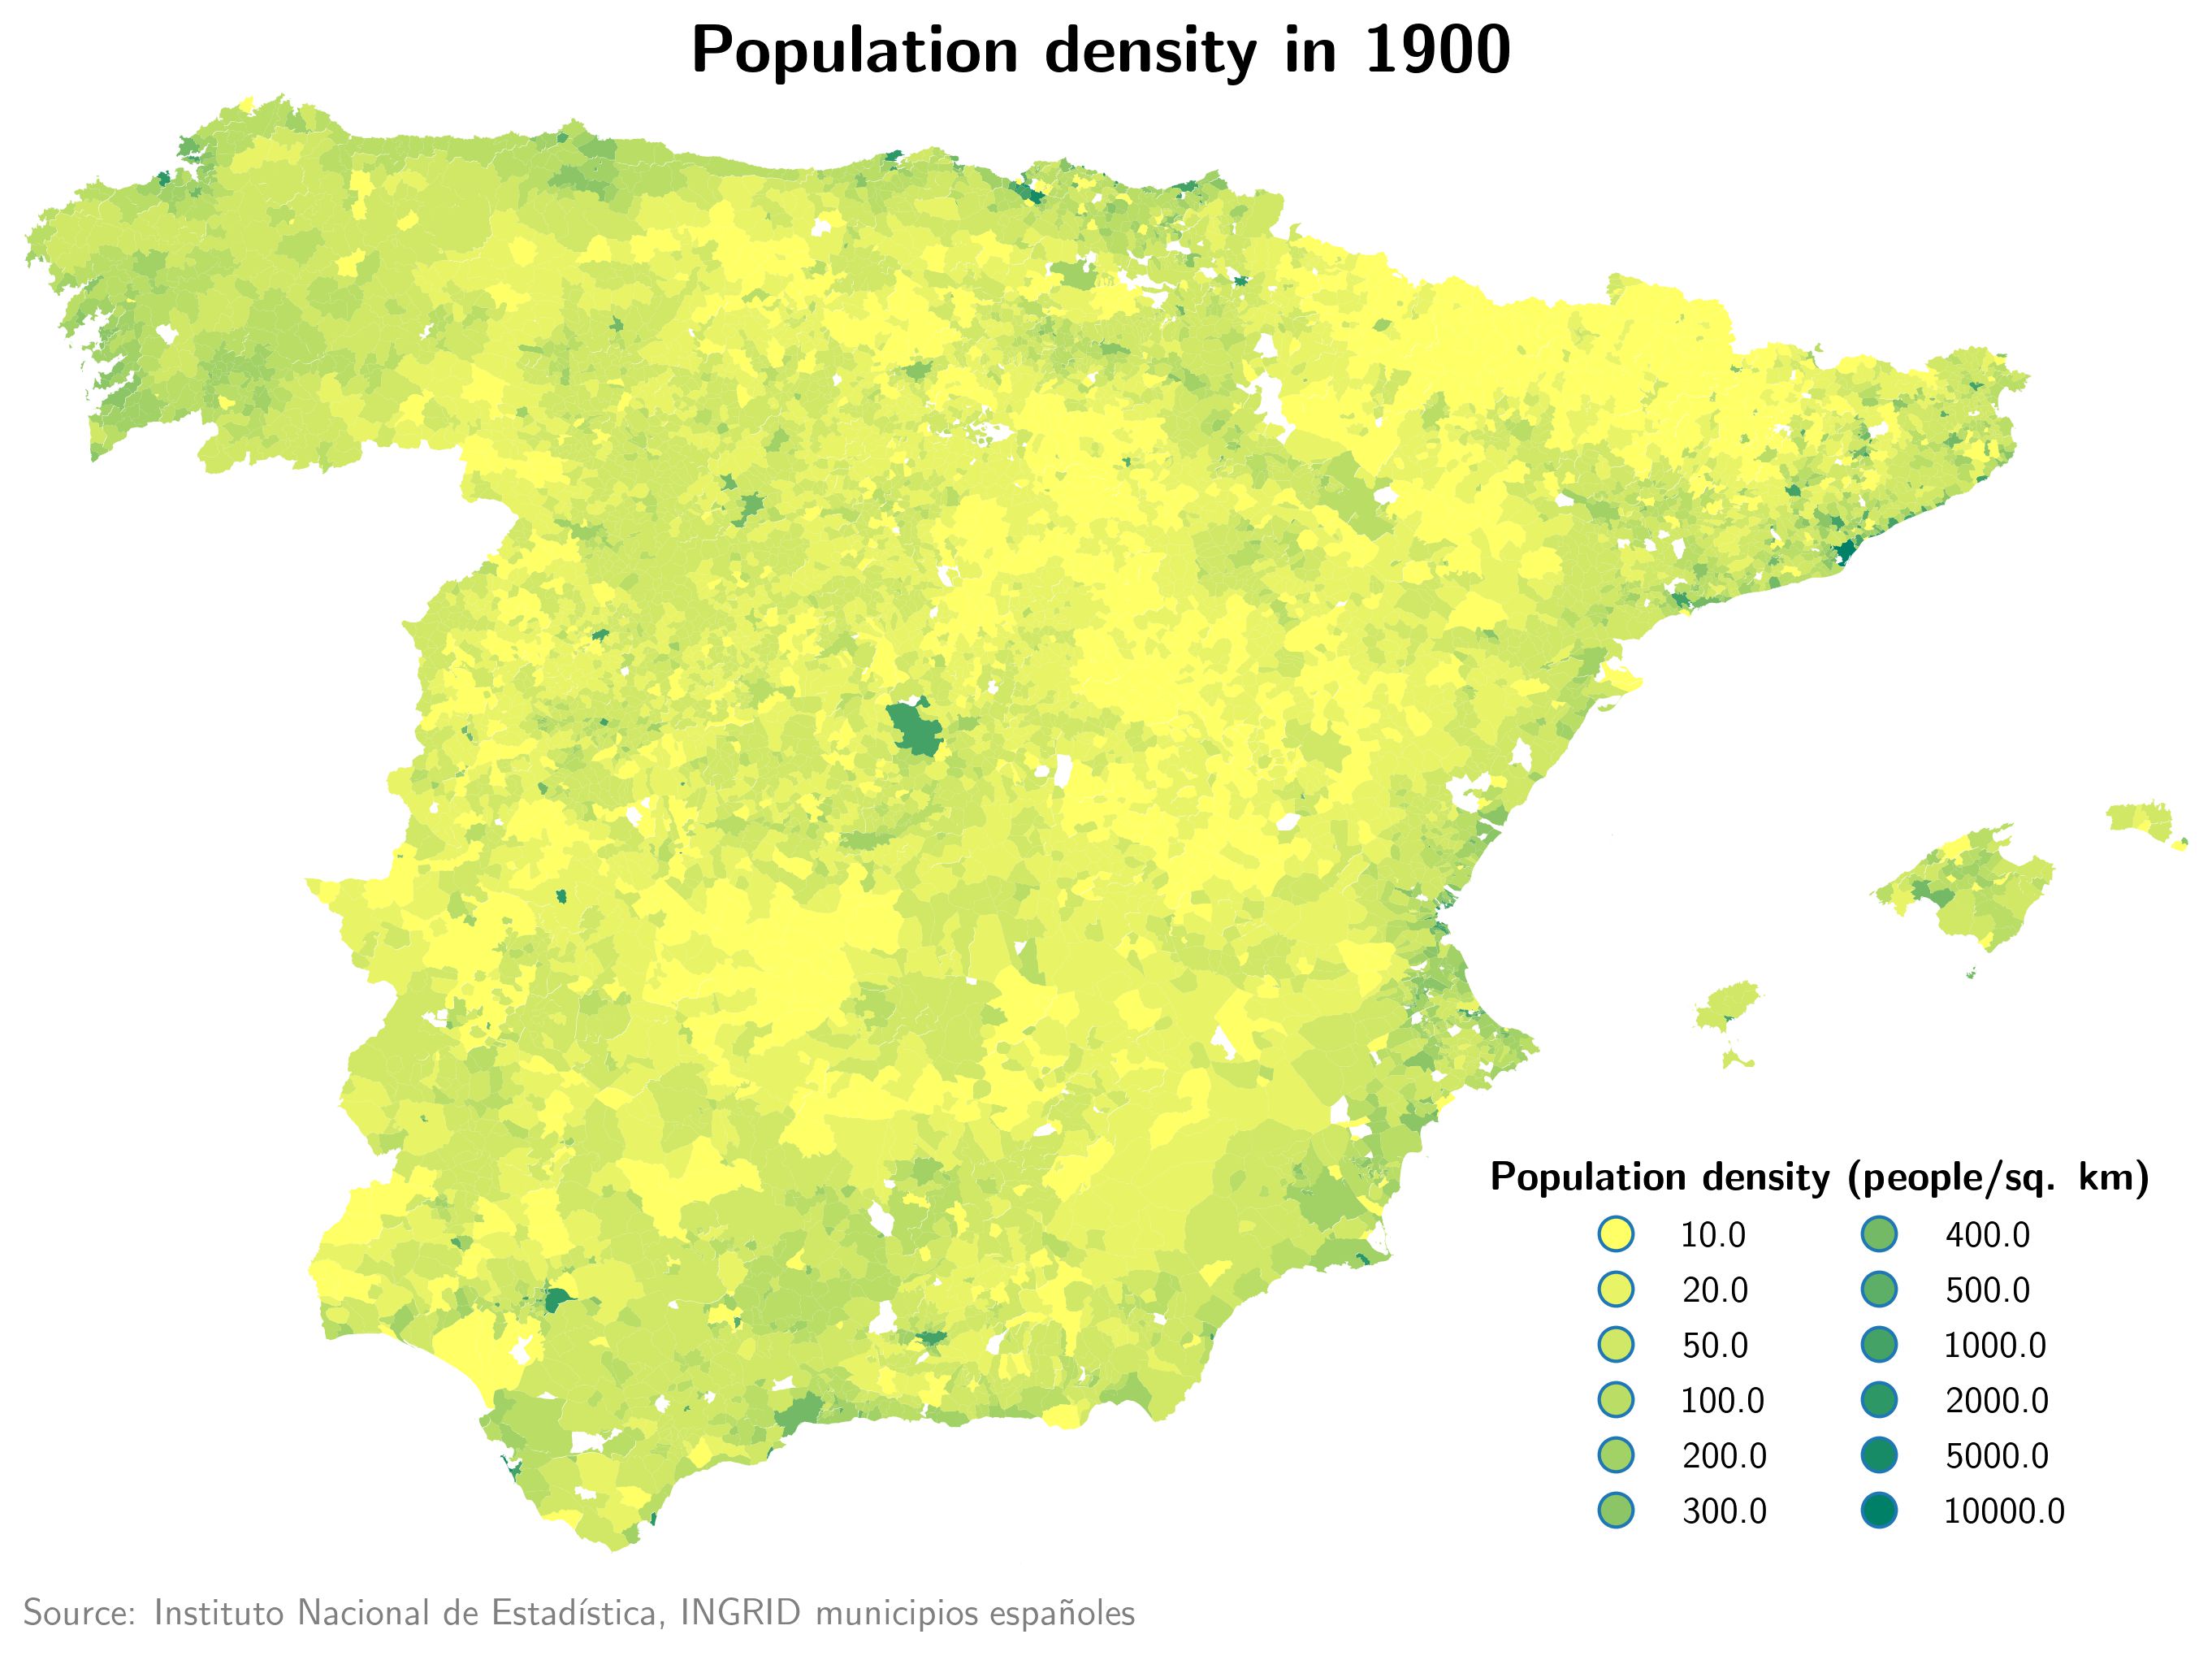

Evidence on these trends can be found through population density maps. A one-to-one comparison between Spanish municipalities’ inhabitants density in the years 1900 and 2001 shows how political and economical developments shaped modern national demographics, using a yellow-green color palette where the greener the color, the higher the density. The light green color of the 1900 Spain map is replaced by a bright yellow of the contemporaneous one, meaning the Spanish population was far more homogeneously distributed back in the early 20th Century than in recent years. Although some large metro areas were already visible in 1900, only extremely interior regions (the North of Aragón, the East of Castilla y León and Western Castilla-La Mancha) presented really poor density numbers. On the contrary, the 2001 map reflects the consequences of centrifugue migrations: the vast rural core of the country is at its all-time minimum population density values and large cities (especially those in the coast) are concentrating much larger amounts of people than they did one century ago.
The Spanish population today
Bibliography and data sources
Data on historical cities population
